AI as Your Form Data Analyst: Turning Google Sheets Submissions into Weekly Insight Briefs

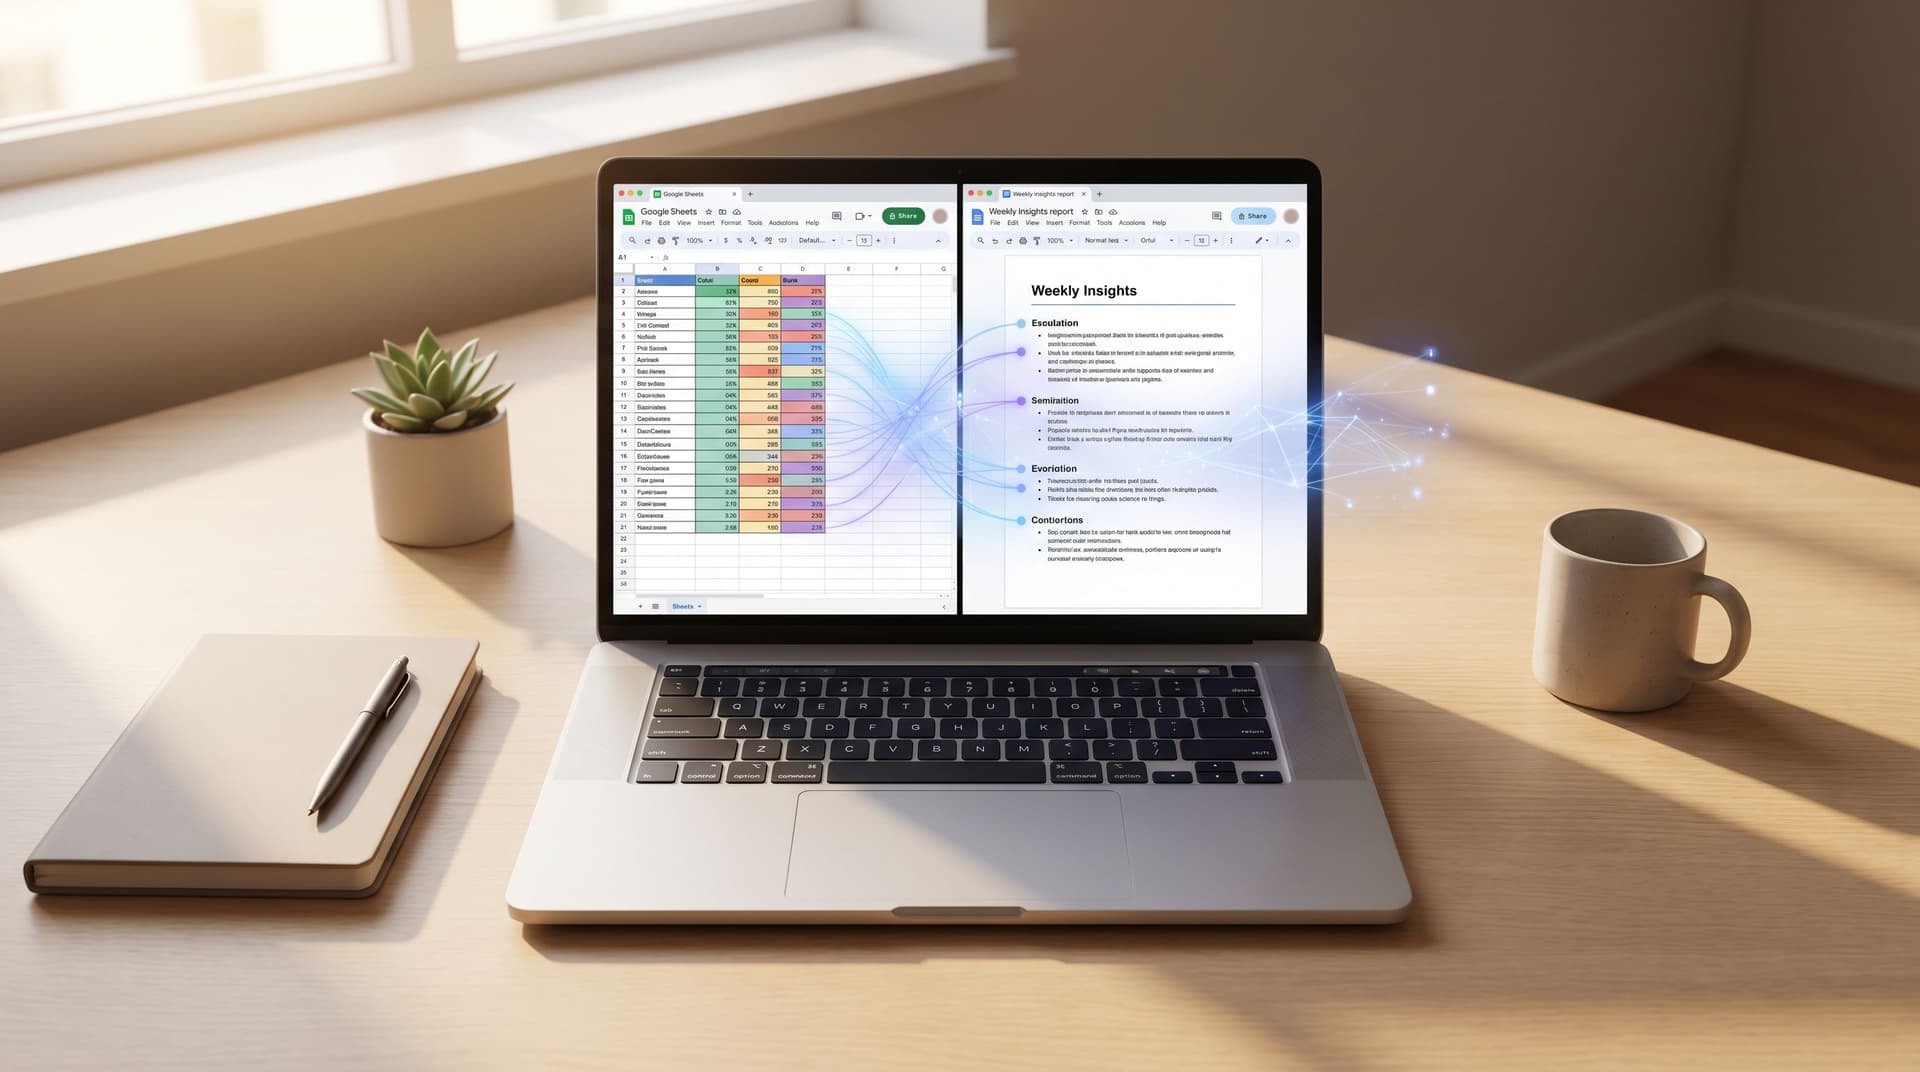
Your forms are already doing the hard work: capturing leads, feedback, signups, bug reports, beta interest, and more. The problem isn’t collecting data—it’s using it.
If you’re syncing Ezpa.ge forms into Google Sheets, you’re sitting on a live stream of structured responses. But for most teams, that stream turns into a swamp: hundreds or thousands of rows that only get touched when someone has time to “dig in.”
AI changes that. Instead of treating your Sheet as a place where data goes to nap, you can treat it as the input to a weekly insight brief: a concise, opinionated summary of what your users told you, what changed since last week, and what you should do next.
This post is about how to make AI your form data analyst—especially when Ezpa.ge is feeding your Google Sheet in real time.
Why Turning Submissions into Weekly Briefs Matters
When form data just accumulates, you get:
- Slow reactions – You notice patterns months after users started shouting.
- Gut-driven decisions – Strategy meetings rely on anecdotes from whoever spoke last.
- Wasted research – You run surveys, NPS pulses, and feedback forms that never feed back into the roadmap.
Turning that same data into a weekly insight brief flips the script:
- Continuous visibility – Every week, stakeholders see what users are saying now, not last quarter.
- Prioritized signal – AI can cluster, summarize, and highlight the most important shifts, not just raw counts.
- Actionable stories – Instead of “we got 237 responses,” you get “churn risk is rising among new self‑serve teams because onboarding feels rushed.”
If you’ve already read Form UX for Customer Research: Turning Signups and Surveys into Always-On Insight Streams, this is the natural next step: you’re not just collecting streams of data—you’re turning them into a recurring narrative your team can act on.
The Core Idea: AI as a Lightweight Analyst, Not a Magic Oracle
AI is excellent at a few specific jobs that pair perfectly with form data:
- Summarizing long lists of responses into themes.
- Clustering similar answers (e.g., feature requests, pain points).
- Comparing this week vs. last week.
- Rewriting raw insights into executive‑ready bullets.
It is not excellent at:
- Making up data you don’t have.
- Replacing real user quotes and context.
- Knowing your business constraints.
So the goal isn’t “push button, get perfect strategy.” The goal is:
Push button, get a 70%‑good draft of an insight brief that a human can polish in 10–15 minutes instead of 2–3 hours.
Once you frame AI as a junior analyst who never gets tired of reading spreadsheets, the workflow becomes much clearer.
Step 1: Design Forms with Analysis in Mind
Weekly briefs are only as good as the data feeding them. Before you worry about prompts or tools, make sure your forms are structured for analysis.
Make every field earn its place
If your forms are bloated, your data will be noisy. Tighten your questions so that every field serves a clear analytical purpose.
- Prefer fewer, more intentional fields over long, unfocused forms.
- Ask yourself for each field: “What decision will this help us make?”
If you haven’t yet, read The Minimal Field Manifesto: How Fewer Inputs Can Actually Enrich Your First-Party Data. It walks through how trimming fields can actually improve what your AI analyst has to work with.
Mix structured and unstructured fields
AI thrives when you combine:
- Structured fields – dropdowns, checkboxes, radio buttons (e.g., plan type, company size, role, use case).
- Open‑text fields – free‑form answers where people explain their goals, frustrations, or requests.
This lets you:
- Slice insights by segment (e.g., “What are enterprise users complaining about this week?”).
- Let AI find patterns in the messy, human language.
Standardize labels and options
AI can handle messy data, but you pay the price later.
- Use consistent field names across forms (e.g., always
company_size, notsizein one form andteam_scalein another). - Normalize option labels (e.g., always “1–10 employees,” not “1–10 ppl” vs. “1-10 staff”).
This is where Ezpa.ge’s reusable themes and templates help: once you’ve named fields cleanly in one form, you can reuse that structure across others instead of reinventing it every time.
Step 2: Set Up a Clean Google Sheet Back-End
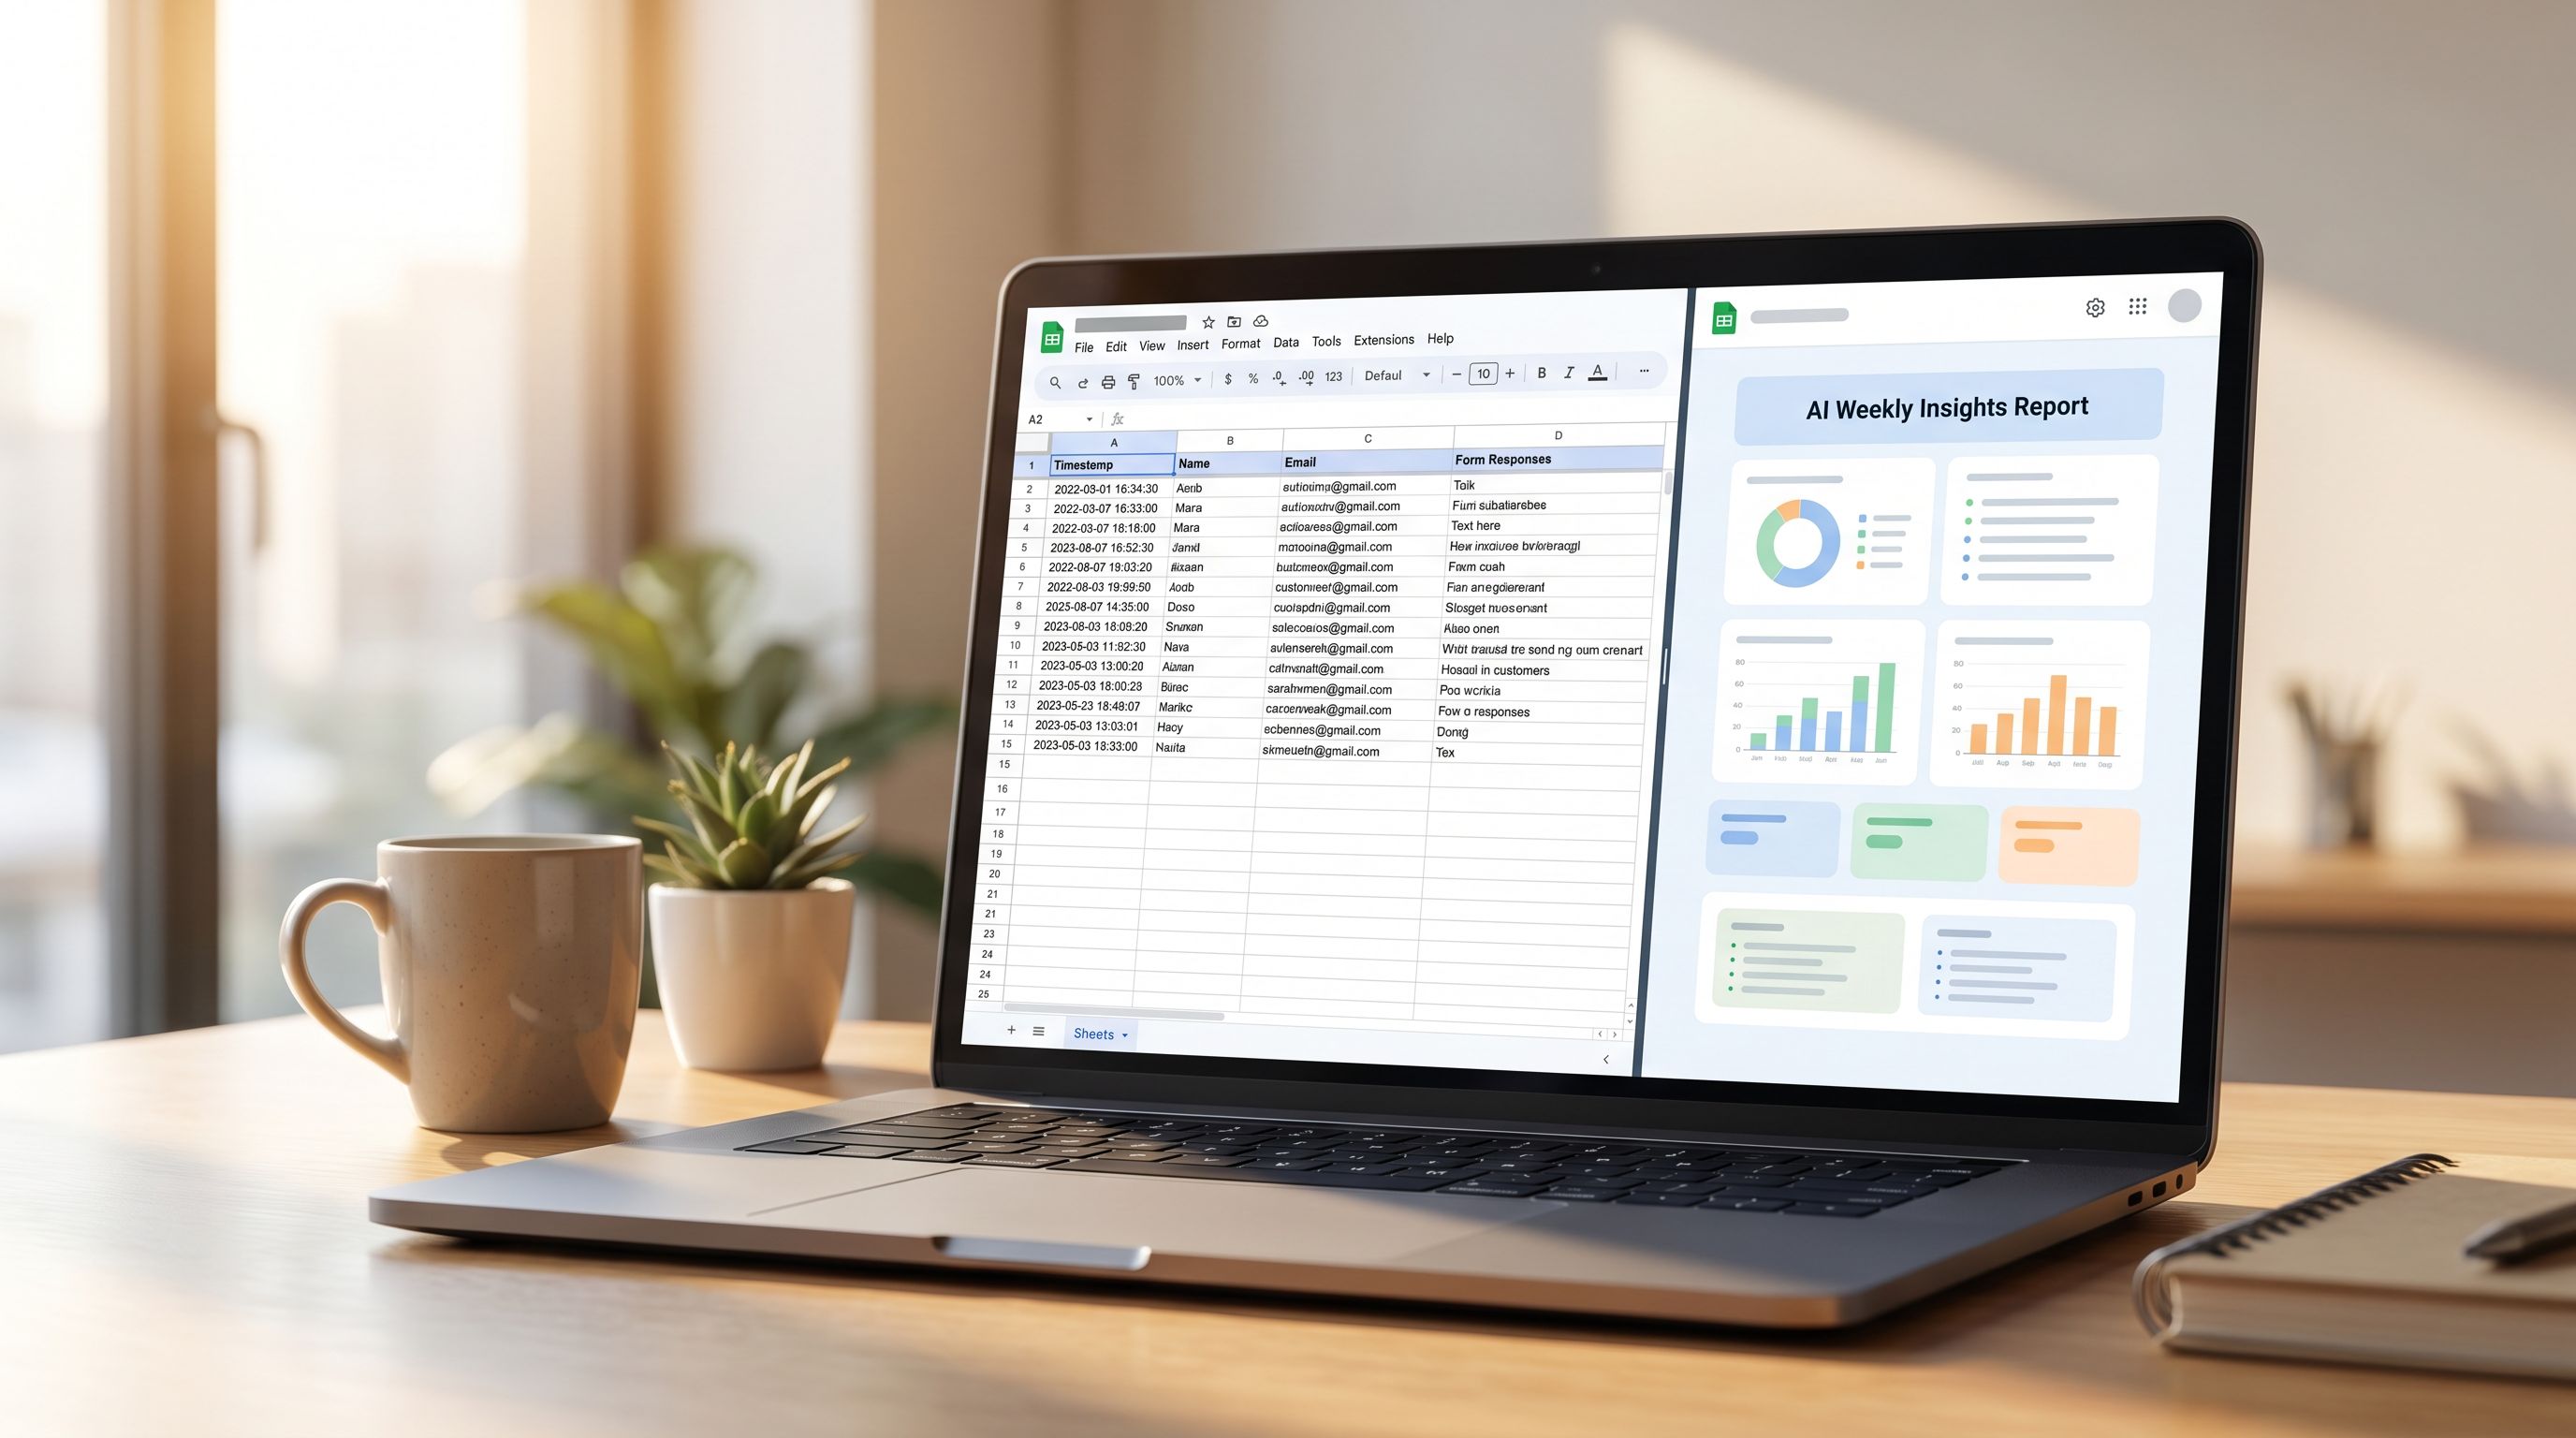
With Ezpa.ge, every submission can land in a live Google Sheet. To make that Sheet analyst‑ready, add a bit of structure.
Use one Sheet per “question set”
Don’t cram every form you’ve ever made into a single sheet.
- Create separate Sheets for distinct workflows: e.g.,
Onboarding_Survey,Feature_Requests,NPS,Beta_Waitlist. - If you must combine them, include a clear
form_typecolumn.
Add helper columns for segmentation
Even if your form doesn’t ask for it directly, you can enrich your data in the Sheet:
week_of– a formula that converts the submission timestamp to the Monday of that week.segment– combine fields like plan type + company size (e.g.,=CONCATENATE(plan, " - ", company_size)).source_channel– if your Ezpa.ge form uses different custom URLs per channel, you can infer this from the URL or UTM parameters.
These helper columns make it easier to ask AI specific questions later: “Summarize feedback from enterprise customers on the Pro plan this week vs. last week.”
Keep a clean header row
AI tools that connect to Sheets often expect:
- A single header row with clear, human‑readable names.
- No merged cells or decorative rows.
Think of row 1 as the contract between your forms, your Sheet, and your AI analyst.
Step 3: Choose How AI Will Connect to Your Sheet
You have a few paths here, depending on your tools and comfort level.
Option A: Direct Sheet → AI tool connection
Many AI‑powered analytics tools can connect directly to Google Sheets. Look for ones that:
- Let you select a specific tab or range.
- Support scheduled runs (e.g., weekly at a set time).
- Allow custom prompts or templates.
You’d typically:
- Connect your Google account.
- Point the tool at your Ezpa.ge response Sheet.
- Configure a recurring “analysis job” (e.g., every Monday at 9am).
Option B: Manual export + prompt (lightweight, no‑code)
If you’re not ready for another tool in your stack:
- Filter your Google Sheet to the last 7 days.
- Copy relevant columns (e.g., timestamp, segment, key questions) or export as CSV.
- Paste the data into an AI chat interface that supports large inputs.
- Use a structured prompt (we’ll get to that next).
This takes 10–15 minutes per week and is surprisingly effective for smaller teams.
Option C: Automations with Apps Script or no‑code tools
If you have some automation appetite:
-
Use Google Apps Script to:
- Pull last week’s rows.
- Format them as JSON.
- Send them to an AI model via API.
- Write the returned summary into a “Weekly Briefs” tab or even email it to your team.
-
Or use tools like Zapier, Make, or similar to:
- Trigger on new rows or on a weekly schedule.
- Fetch rows from your Sheet.
- Call an AI step with a custom prompt.
- Post the brief into Slack or email.
You don’t have to start here, but it’s where many teams end up once they see the value of the briefs.
Step 4: Design a Reliable Weekly Brief Template
Raw AI output can be messy. A consistent template keeps things readable and comparable week over week.
Here’s a simple structure that works well for most teams:
-
Overview (3–5 bullets)
- What changed vs. last week.
- Any notable spikes or drops.
- One sentence on overall sentiment.
-
Top Themes
- 3–7 themes, each with:
- A short title.
- 2–3 bullets.
- 1–2 anonymized example quotes.
- 3–7 themes, each with:
-
Segment Highlights
- Per key segment (e.g.,
Enterprise,SMB,Free tier):- What they’re happy about.
- What’s frustrating them.
- Any new patterns.
- Per key segment (e.g.,
-
Priority Actions (ranked)
- 3–5 recommended actions.
- Each with:
- Impact (High/Medium/Low).
- Effort (High/Medium/Low).
- Evidence (which questions/segments they’re based on).
-
Open Questions
- 2–4 follow‑up questions for the team to answer or investigate.
You can ask AI to always return the brief in that structure. Over a few weeks, you’ll tune the template to match how your team likes to consume information.
Step 5: Use Strong Prompts That Reflect Your Context
The difference between “meh” and “useful” often comes down to your prompt.
Here’s a prompt pattern you can adapt (trim or expand as needed):
You are a customer insights analyst for a SaaS product. I will give you a table of form submissions from the past 7 days. Each row includes: timestamp, segment, plan, NPS score (if present), and open-text responses about goals, frustrations, and feature requests.
- Summarize the top 5 themes from this week’s responses.
- For each theme, include:
- A short title.
- 2–3 bullets describing the pattern.
- 1–2 anonymized example quotes (paraphrased, not verbatim).
- Compare this week’s themes to last week’s (I will paste last week’s brief below). Note what’s new, growing, or shrinking.
- Propose 3–5 prioritized actions for the product and CX teams. For each action, include:
- Impact (High/Medium/Low).
- Effort (High/Medium/Low).
- Which segments and responses support this.
- Return the answer in this structure:
- Overview
- Top Themes
- Segment Highlights
- Priority Actions
- Open Questions
If you’re feeding the AI both the raw data and last week’s brief, it can reason about trends instead of just giving you a one‑off snapshot.
Over time, you can specialize prompts for different form types:
- NPS surveys – focus on detractors and passives, churn risk, and quick wins.
- Feature requests – cluster by product area, highlight high‑impact/low‑effort ideas.
- Beta feedback – track onboarding friction, quality issues, and “aha” moments.
For more ideas on how to structure beta‑era feedback, pair this with Forms for Product Betas: Waitlists, Access Codes, and Rapid Feedback Loops in One Sheet-Backed Stack.

Step 6: Close the Loop With Your Team
A weekly insight brief is only as valuable as what happens after it’s sent.
Make it a recurring ritual
- Pick a fixed time (e.g., every Monday morning) for the brief to land in Slack or email.
- Add a 15–20 minute review slot to your product or growth standup.
- Ask the same questions each week:
- What surprised us?
- What patterns confirm what we already suspected?
- What are we going to do differently this week because of this brief?
Track which actions came from which insights
Create a light touch system:
- Add a column in your backlog or roadmap tool:
Source = Weekly Brief #NN. - In the brief itself, add a short “Decisions made” section the following week.
This reinforces that the brief isn’t just a report—it’s a driver of real decisions.
Share back with users
When you act on feedback, tell people.
- “You told us onboarding felt confusing; we simplified the first step and removed two fields.”
- “Multiple beta testers flagged that our mobile form was hard to complete one‑handed; we’ve updated our layout accordingly.”
If you’re working on those mobile improvements, you’ll find practical patterns in Mobile-First Forms in a Desktop-Designed World: Fixing Thumb Zones, Keyboards, and Tap Targets.
This closes the loop and encourages richer responses in future forms.
Step 7: Respect Privacy and Guardrails
As you start piping user data into AI tools, keep trust front and center.
- Minimize PII in what you send to third‑party tools. Where possible, strip names, emails, and IDs before analysis.
- Document which tools have access to which Sheets.
- Review vendor policies around data retention and training.
If your audience is privacy‑sensitive (and most are), it’s worth revisiting your intake design with that lens. Forms for Privacy-Conscious Users: Designing High-Trust Intakes When Your Audience Is Skeptical goes deep on how to ask for data in ways that feel safe and transparent.
AI doesn’t remove your responsibility here; it raises the bar on being explicit about where data goes and why.
Putting It All Together: A Simple First Week Plan
If you want to try this next week, here’s a concrete path:
This week
- Pick one form that already syncs to Google Sheets via Ezpa.ge (e.g., your main feedback or onboarding survey).
- Clean the Sheet:
- Make sure headers are clear.
- Add helper columns for
week_ofandsegment.
- Collect responses as usual.
Next Monday
- Filter the Sheet to the last 7 days.
- Export or copy the relevant rows.
- Paste them into your AI tool with a tailored version of the prompt above.
- Ask the AI to generate a brief using the template (Overview → Top Themes → Segment Highlights → Priority Actions → Open Questions).
- Spend 10–15 minutes editing for accuracy, tone, and context.
- Share it with your team in Slack or email.
- In your next standup, spend 15 minutes reviewing and picking 1–2 actions.
After 2–3 cycles, you’ll start to see:
- Which questions produce the best insights.
- Which segments need better coverage.
- How to adjust your prompts and templates.
From there, you can automate more of the pipeline and expand to additional Ezpa.ge forms.
Summary
Ezpa.ge already gives you an always‑on stream of structured form data, synced straight into Google Sheets. By layering AI on top as a lightweight analyst, you can:
- Turn scattered responses into weekly, decision‑ready briefs.
- Move from “we have data somewhere” to “we act on what users told us this week.”
- Give every team a clear window into user goals, frustrations, and requests—without asking anyone to live in spreadsheets.
The key is not complexity. It’s intention:
- Design forms with analysis in mind.
- Keep your Sheets clean and segment‑aware.
- Use consistent brief templates and strong prompts.
- Build a simple ritual around reading and acting on the insights.
Do that, and AI stops being an abstract buzzword and starts feeling like a real teammate—one who reads every single submission and shows up every week with a clear, concise story.
Ready to Let AI Read Your Forms for You?
You don’t need a data team or a new analytics platform to start.
If you’re already using Ezpa.ge:
- Pick one high‑leverage form (signups, onboarding, or feedback).
- Make sure it’s syncing cleanly into Google Sheets.
- Block 30 minutes on your calendar next Monday to run your first AI‑powered weekly brief.
From there, you can iterate: refine your questions, sharpen your prompts, and expand to more forms.
Your users are already telling you what they need—every day, through every Ezpa.ge form you ship. Let AI handle the grunt work of reading it all, so your team can focus on building what matters next.