Sheets-Native Scoring: Building Lead, Churn, and Fit Models with Only Form Data and Formulas


If your forms already flow into Google Sheets, you’re sitting on a scoring engine you probably aren’t using.
You don’t need a CDP, a data warehouse, or a custom ML model to:
- Prioritize sales leads
- Spot customers at risk of churning
- Identify your best-fit users and accounts
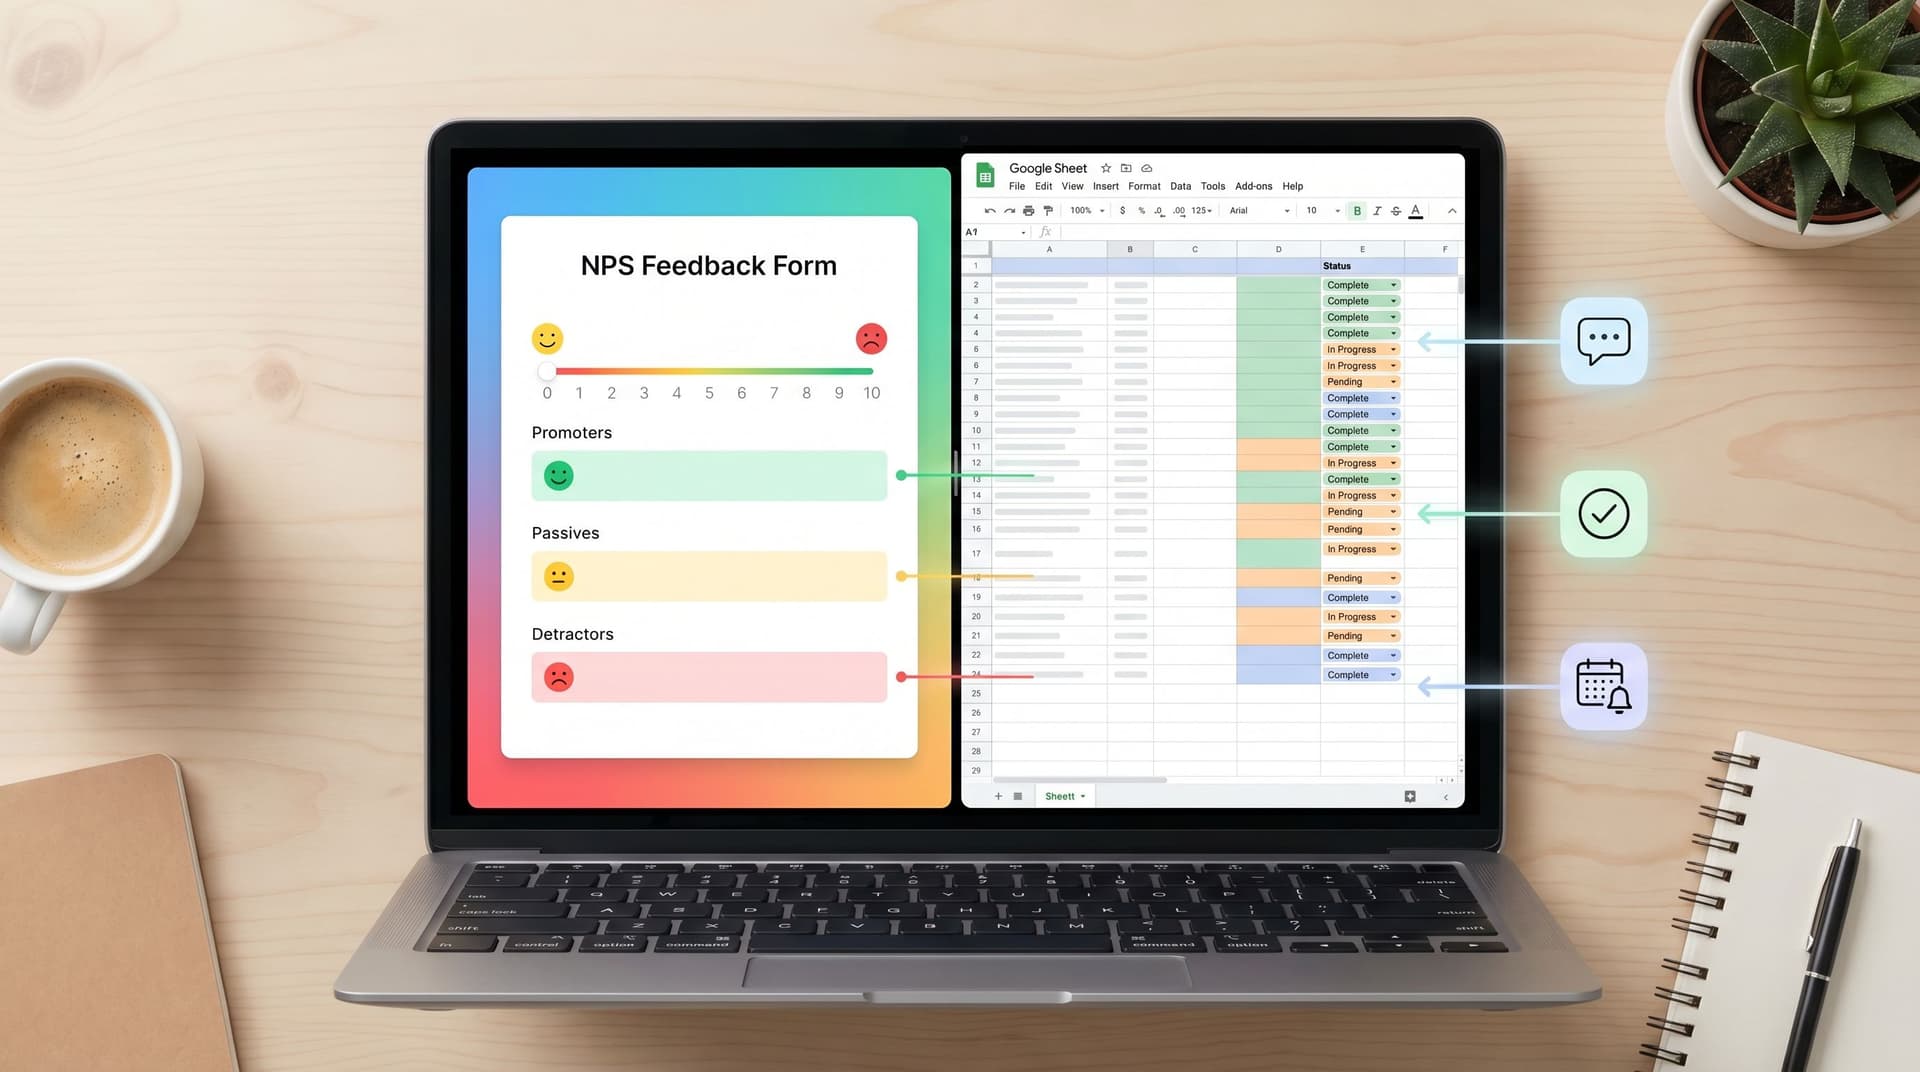
You can do all of that with only form data and formulas—especially when your forms are built in Ezpa.ge and synced to Sheets in real time.
This post is a practical walkthrough of how to turn that “just a spreadsheet” into a lightweight scoring system that your team can actually maintain.
We’ll cover:
- The core idea of sheets-native scoring (and why it works)
- How to design forms that capture the right signals
- Step‑by‑step examples of lead scoring, churn risk scoring, and fit scoring in Google Sheets
- How to plug scores into routing, follow-up, and weekly review rituals
Why Scoring Directly in Sheets Is So Powerful
Most teams feel the pain that scoring is supposed to solve:
- Sales reps don’t know which leads to call first.
- CS teams can’t see which customers are quietly slipping away.
- Product and marketing can’t agree on what “good fit” actually means.
The instinct is to reach for more tooling—CRMs, analytics platforms, or data science projects. But there’s a simpler path: do the math where the data already lives.
When your Ezpa.ge forms sync into Google Sheets:
- You already have the raw signals. Company size, use case, budget, NPS, feature interest, etc.
- Everyone knows how to use Sheets. No new interface, no training cycle.
- You can iterate quickly. Change a weight in one cell and your entire scoring model updates.
- You stay close to the workflow. Scores can feed straight into views you review every week, instead of disappearing into a dashboard no one opens. (If you’re building these weekly habits, you’ll like how we approach that.)
Sheets-native scoring is about treating formulas as your scoring engine and forms as your signal collectors.
Start with the Questions, Not the Formula
Before you touch a single IF statement, answer three questions for each model you want to build:
-
What decision do we want this score to drive?
Examples:- Should this lead go to an AE or SDR?
- Should we trigger a same-day outreach from CS?
- Should we invite this user to a research interview?
-
What outcomes define success or failure?
For leads, that might be demo booked or closed-won. For churn, it might be downgrade or non-renewal. -
Which signals do we already collect that correlate with those outcomes?
You don’t need perfect correlation—just reasonable hypotheses:- Leads from certain industries close more.
- Accounts with low NPS and low usage churn more.
- Users with specific use cases tend to expand.
Only then should you ask: What should we change in our forms, and what formulas do we need in Sheets?
Designing Forms That Capture Scoring Signals
You can’t score what you don’t collect. The good news: you don’t need to turn every form into a 20-field interrogation.
Instead, treat each form as a chance to collect a few high-signal fields that feed your models over time.
High-Signal Fields for Lead Scoring
For lead forms (demo requests, pricing inquiries, waitlists), consider adding:
- Company size (picklist ranges, not free text)
- Role / seniority (e.g., "IC", "Manager", "Director", "VP+" as options)
- Primary use case (multi-choice, not open text)
- Timeline to buy (e.g., "0–30 days", "1–3 months", "3–6+ months")
- Tech stack fit (e.g., "We use Google Workspace", "We use Microsoft 365")
These are all easy to score with simple IF and VLOOKUP logic.
If you’re sending traffic directly into forms (without a classic landing page), you’re already on the right track—see how this plays with form-led funnels in this post on form-first lead gen.
High-Signal Fields for Churn Risk
For feedback, NPS, and support forms, you’re looking for health signals:
- NPS / satisfaction rating (0–10 or 1–5)
- Sentiment-coded reason (e.g., “Missing feature,” “Too expensive,” “Hard to use”)
- Plan tier (Free, Pro, Enterprise)
- Tenure (e.g., auto-populated via hidden fields or lookup in Sheets)
- Self-reported likelihood to renew (for renewal surveys)
If you’re already collecting feedback into Sheets, you can layer scoring on top of the workflows from our NPS-to-actions guide.
High-Signal Fields for Fit Models
Fit models are about who is right for your product, not just who is active or likely to buy tomorrow.
Good candidates:
- Industry / segment
- Team size or org structure
- Primary job-to-be-done (“What are you hiring this tool for?”)
- Budget band (if appropriate)
- Existing tools / integrations
You can collect these gradually using progressive profiling techniques instead of asking everything at once. If that’s a concern, bookmark our piece on progressive profiling that doesn’t annoy people.

Building a Simple Lead Scoring Model in Google Sheets
Let’s walk through a concrete example using only standard formulas.
Assume your Ezpa.ge “Request a demo” form syncs to a Sheet with these columns:
TimestampEmailCompanyCompany SizeRoleUse CaseTimelineSource(UTM or campaign)
We’ll add a few new columns:
Company Size ScoreRole ScoreUse Case ScoreTimeline ScoreTotal Lead ScoreLead Tier
Step 1: Define Your Scoring Rules
You can keep this as simple as a separate “Config” tab:
Config!A1:D?
- Column A: Attribute (e.g.,
Company Size) - Column B: Value (e.g.,
1–10,11–50,51–200,200+) - Column C: Points (e.g.,
5,10,20,30) - Column D: Notes
Do the same for Role, Use Case, and Timeline.
Step 2: Translate Attributes to Scores
Back in your main Leads tab:
-
Company Size Score (e.g., column H):
=IFERROR(VLOOKUP(D2, Config!$B$2:$C$10, 2, FALSE), 0)D2isCompany Size.Config!B2:C10contains size values and their points.
-
Role Score (e.g., column I):
=IFERROR(VLOOKUP(E2, Config!$B$12:$C$20, 2, FALSE), 0) -
Use Case Score (e.g., column J):
=IFERROR(VLOOKUP(F2, Config!$B$22:$C$40, 2, FALSE), 0) -
Timeline Score (e.g., column K):
=IFERROR(VLOOKUP(G2, Config!$B$42:$C$50, 2, FALSE), 0)
Step 3: Combine into a Total Score
In L2 (Total Lead Score):
=H2 + I2 + J2 + K2
If you want to weight certain attributes more heavily, you can multiply them:
=H2*1.5 + I2*1 + J2*2 + K2*1
Step 4: Bucket Leads into Tiers
In M2 (Lead Tier):
=IFS(
  L2>=80, "A - Hot",
  L2>=50, "B - Warm",
  L2>=30, "C - Nurture",
  TRUE, "D - Low"
)
Now you have a sortable, filterable score and a clear label you can use for routing.
Step 5: Use Conditional Formatting for Visual Triage
- Highlight the
Lead Tiercolumn. - Add conditional formatting rules:
Text is exactly "A - Hot"→ Green background.Text is exactly "B - Warm"→ Light green.Text is exactly "C - Nurture"→ Yellow.Text is exactly "D - Low"→ Gray.
Your team can open this Sheet and instantly see where to focus.
Churn Risk Scoring: Turning Feedback into Early Warnings
Churn scoring works similarly, but you’re looking at health instead of intent to buy.
Imagine you have an Ezpa.ge “How are we doing?” form that syncs to a Feedback Sheet with:
TimestampEmailAccount IDPlan TierNPS Score(0–10)Reason Category(multi-choice)Freeform Comment
We’ll add:
NPS Risk ScoreReason Risk ScorePlan WeightTotal Churn RiskRisk Level
Step 1: Map NPS to Risk Points
On a Config tab:
NPS 0–6→30points (high risk)NPS 7–8→10points (medium)NPS 9–10→0points (low)
In N2 (NPS Risk Score) on Feedback:
=IFS(
  E2<=6, 30,
  E2<=8, 10,
  E2>=9, 0,
  TRUE, 0
)
Step 2: Score Reason Categories
On Config, define:
"Too expensive"→20"Missing feature"→15"Hard to use"→25"Other"→5
Then in O2 (Reason Risk Score):
=IFERROR(VLOOKUP(F2, Config!$B$60:$C$80, 2, FALSE), 0)
Step 3: Weight by Plan Tier
Enterprise churn might matter more than free-plan churn.
On Config:
Free→0.5Pro→1Enterprise→2
In P2 (Plan Weight):
=IFERROR(VLOOKUP(D2, Config!$B$90:$C$95, 2, FALSE), 1)
Step 4: Calculate Total Churn Risk
In Q2 (Total Churn Risk):
=(N2 + O2) * P2
Step 5: Bucket into Risk Levels
In R2 (Risk Level):
=IFS(
  Q2>=80, "High",
  Q2>=40, "Medium",
  TRUE, "Low"
)
Now you can:
- Filter for
Highrisk accounts weekly. - Add a view that groups by
Account IDto see patterns. - Trigger manual outreach or automated playbooks based on risk.
If you’re already turning feedback into playbooks, this slots neatly on top of the workflows described in our feedback-to-action post.

Fit Models: Agreeing on What “Good” Looks Like
Lead and churn scores help with priority. Fit scores help with strategy.
A fit model answers questions like:
- Which segments should we design for first?
- Which users should we recruit for research?
- Which accounts are ideal candidates for betas or case studies?
You can build a fit score from any form that captures richer context:
- Onboarding questionnaires
- Research intake forms
- Beta waitlists
Example: Onboarding Fit Score
Imagine an Ezpa.ge onboarding form that asks:
IndustryTeam SizePrimary Goal(what they’re trying to achieve)Key Constraint(e.g., time, budget, compliance)
In Sheets, add:
Industry Fit ScoreTeam Size Fit ScoreGoal Fit ScoreTotal Fit ScoreFit Tier
The formulas look almost identical to the lead scoring example—just with different mappings in your Config tab.
The difference is how you use the result:
- Product: Filter for
Fit Tier = "A"when recruiting for discovery calls. - Marketing: Analyze which campaigns bring in the highest average fit scores.
- CS: Offer white-glove onboarding to
AandBfit accounts.
Over time, you can compare fit scores to actual outcomes (retention, expansion, referrals) and refine your mappings.
Wiring Scores into Real Workflows
Scores are only useful if they cause something to happen.
Here are a few ways to plug your new columns into the way your team already works.
1. Views for Each Team
Use Filters or Filter Views in Google Sheets to create saved perspectives:
Sales – Hot Leads:Lead Tier = "A - Hot"CS – High Churn Risk:Risk Level = "High"Research – High Fit New Users:Fit Tier = "A"andSignup Date = last 14 days
Share each view’s URL with the relevant team. They don’t need to understand the formulas—just how to use the view.
2. Weekly Review Rituals
Set a recurring meeting where you:
- Open the same Sheet and same views every week.
- Review:
- New A-tier leads and what happened to last week’s.
- High-risk accounts and follow-up status.
- Fit segments that are growing or shrinking.
This is exactly the kind of rhythm we unpack in our piece on ops analytics rituals.
3. Lightweight Automation
You can keep this entirely Sheets-native, or add light automation:
- Use Google Apps Script or tools like Zapier / Make to:
- Send a Slack alert when a new
A - Hotlead appears. - Create a follow-up task in your CRM or project tool when
Risk Level = "High". - Add high-fit users to a special mailing list or beta cohort.
- Send a Slack alert when a new
All of this can key off the scoring columns you’ve already built.
Keeping Your Models Honest
Scoring models have a tendency to drift or calcify. The advantage of Sheets-native scoring is that you can see and adjust the logic in plain sight.
A few practices that help:
- Centralize your mappings. Keep all score mappings in one
Configtab instead of burying numbers insideIFstatements. - Version your changes. Add a small table:
Date,Change,Reason,Owner. When you tweak weights, log it. - Backtest occasionally.
- Duplicate your Sheet.
- Filter for deals that closed or accounts that churned.
- Check whether your scores lined up with reality.
- Limit the number of inputs. More fields ≠ better model. Start with 3–5 strong signals, then add slowly.
If you ever decide to move to a more advanced tool later, this discipline will pay off—your logic is already explicit and documented.
Summary
You don’t need a complex stack to score leads, churn risk, or fit. With Ezpa.ge forms syncing into Google Sheets, you already have everything you need:
- Forms to capture structured, high-signal data.
- Sheets to store it in rows and apply transparent, editable formulas.
By:
- Asking a few high-signal questions in your forms,
- Mapping responses to points in a simple Config tab, and
- Combining those into scores and tiers that your team can actually use,
…you can prioritize better, react earlier, and align around what “good” looks like—without new tools or a data team.
The magic isn’t in fancy algorithms. It’s in clear logic, simple formulas, and consistent use.
Your Next Step
You don’t have to build a perfect model on day one. Start with one decision and one score.
- Pick a single flow: demo requests, feedback, or onboarding.
- Add or confirm 3–5 high-signal fields in your Ezpa.ge form.
- Sync to Google Sheets (or confirm the sync is working).
- Create a
Configtab and map those fields to points. - Add a
Total Scoreand a simple tier label. - Share a filtered view with the team that will use it this week.
If you’re already using Ezpa.ge, open your most important form and your connected Sheet, and sketch your first scoring model right there. One tab for config, one tab for data, a handful of formulas—that’s enough to turn “just a form” into a working scoring system.
From there, you can layer on routing, automation, and richer models. But the first win is simple: let your forms and Sheets tell you who to focus on next.