Ops Analytics, Not Dashboards: Turning Form + Google Sheets Data into Weekly Decision Rituals


Most teams don’t need another dashboard. They need a habit.
You already have forms capturing leads, requests, feedback, and signups. You already have a Google Sheet quietly filling with rows. But for a lot of teams, that’s where the story ends:
- Someone checks the Sheet when they remember.
- A few ad‑hoc charts get dropped into a slide deck.
- “We should really look at this more often” becomes a running joke.
What’s missing isn’t data or tooling. It’s a repeatable decision ritual: a simple, predictable way to turn form + Sheets data into better choices every single week.
This post is about building exactly that—using Ezpa.ge forms and Google Sheets as your operations analytics backbone, without spinning up a BI project.
Why Dashboards Stall and Rituals Stick
Dashboards are great at showing information. They’re terrible at owning decisions.
Common failure modes:
- Too many metrics, no clear questions. You can see everything, but you’re not sure what you’re supposed to do about it.
- Owned by “data people,” not operators. Ops, CX, and marketing feel like visitors instead of owners.
- Static, not conversational. Dashboards don’t ask, “So what will we change this week?”
Weekly decision rituals flip that:
- You start from questions, not charts.
- You review a small, consistent set of views pulled from your Sheets.
- You leave each session with explicit, tracked decisions and experiments.
When your forms are built with Ezpa.ge and synced directly to Google Sheets, you already have the raw material:
- Every submission is a row.
- Every field is a column.
- Every week is a new block of data to learn from.
The goal is not to “analyze everything.” It’s to design a lightweight operating system that makes your form data impossible to ignore.
Step 1: Decide Which Questions Deserve a Weekly Ritual
Not every form needs a standing meeting. Start with 1–3 flows where small improvements compound quickly.
Good candidates:
- Revenue-critical forms
- Demo requests
- Pricing or consultation inquiries
- Self‑serve upgrade prompts
- Experience-critical forms
- Onboarding surveys
- Support / success intake
- Churn or “Why are you leaving?” forms
- Program-critical forms
- Cohort or community onboarding
- Beta waitlists
- Partner applications
If you’re unsure where to start, look at the systems you’ve already built around forms:
- If you’re using Ezpa.ge forms as the entry point to sales, you’ll get a lot of value from a weekly review of your sales intake data. See also: Form UX for B2B Sales Teams: Designing Intakes That Qualify, Route, and Follow Up Automatically.
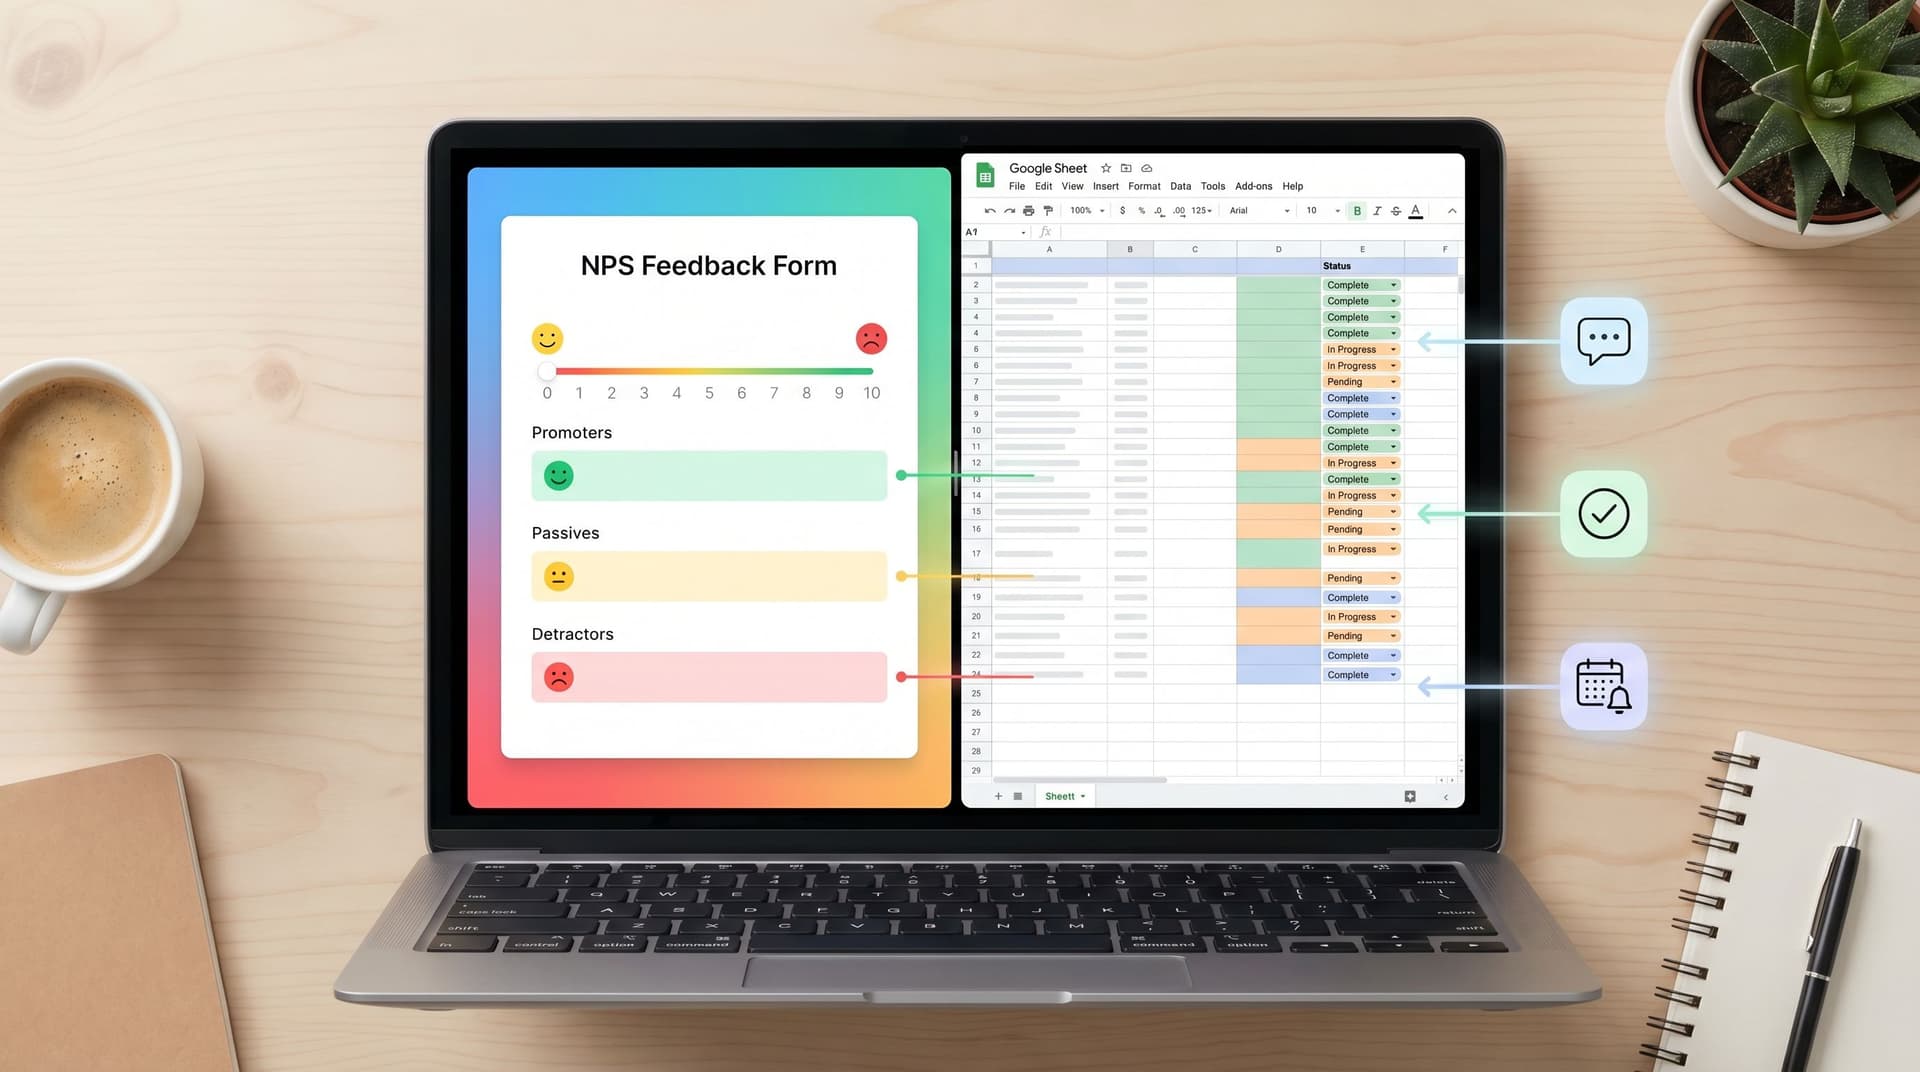
- If your feedback and NPS already land in Google Sheets, you’re one step away from a weekly “signal review.” We went deep on this in From NPS to Next Step: Turning Feedback Forms into Live Playbooks in Google Sheets.
For each candidate form, write down:
- The core question (e.g., “Are we turning high-intent demo requests into qualified conversations within 24 hours?”)
- The lever you can actually pull weekly (copy changes, routing rules, response SLAs, offer tweaks, etc.)
If you can’t name a lever, it’s not a good fit for a weekly ritual yet.
Step 2: Structure Your Forms for Operational Questions, Not Just Fields
Ops analytics starts at the form, not the Sheet.
If your forms only collect email + free‑text comments, you’ll struggle to answer precise questions later. Instead, design your Ezpa.ge forms so that every important decision later has a corresponding field now.
For example, for a demo request form:
- Intent / use case
- "Primary goal" as a single‑select field (e.g., Evaluate for team, Immediate deployment, Just exploring).
- Urgency
- "Timeline to implement" as a dropdown (e.g., This month, This quarter, No timeline yet).
- Fit signals
- Company size bands
- Industry tags
- Product area of interest
These become the backbone of your weekly questions:
- Are we responding faster to high-urgency, high-fit leads?
- Which use cases convert at the highest rate from form to opportunity?
If you’re already using progressive profiling, make sure that the fields you add over time are still decision‑useful, not just “nice to know.” If that’s a gap for your team, read Beyond Required Fields: Progressive Profiling Strategies That Don’t Annoy Returning Users for ideas on what to ask and when.
Checklist: Make your forms analytics-ready
- [ ] Every critical downstream decision has a corresponding field.
- [ ] Free‑text fields are used only where nuance truly matters.
- [ ] Multiple-choice options are mutually exclusive and clearly defined.
- [ ] You capture timestamps, source/UTM, and owner/assignee where relevant.
- [ ] Ezpa.ge is syncing to a single, clean Google Sheet per flow.

Step 3: Turn Your Sheet Into a “Weekly View” Tab
You don’t need Looker, Tableau, or a custom data warehouse to run a weekly ritual. You need one well‑designed tab in the Sheet Ezpa.ge is already updating.
Create a new tab called something like Weekly View – Demo Intake and build around these elements:
1. Time‑boxed filters
Use formulas or filter views to define:
- This week (e.g., Monday–Sunday)
- Last week
- Rolling 4 weeks
In Google Sheets, you can use FILTER, QUERY, or filter views to show only rows where submission_date falls into those ranges. The goal: one click to see only the data you’re reviewing this week.
2. A small set of headline metrics
Think 3–7 metrics that answer your core question. For demo intake, that might be:
- Number of submissions this week
- % of submissions marked high intent
- Median time from submission to first response
- % of submissions that become qualified opportunities
- Top 3 use cases by volume
Use simple formulas:
COUNTIFSfor counts and percentagesMEDIANon response times (calculated asfirst_response_at - submitted_at)SORT+UNIQUEfor top categories
3. A “cases to review” table
Numbers are helpful, but weekly rituals get powerful when you look at specific rows together. Create a small, filtered table that surfaces:
- Outliers (very fast or very slow responses)
- High‑value submissions (large company size, strategic industries)
- Edge cases (unusual use cases, confusing responses)
Practically, this can be:
- A
FILTERrange that pulls only rows meeting certain conditions. - Or a manual “tag for review” checkbox column that people mark during the week.
4. A “Decisions & Experiments” section
At the top or bottom of the Weekly View tab, reserve a small area for:
- Decision log (date, decision, owner, rationale)
- Experiments (what we’ll change, how we’ll measure, when we’ll review)
This is where your ritual becomes compounding. You’re not just looking at data—you’re building a history of how you responded to it.
Step 4: Design the Weekly Ritual Itself
Now that your data is structured and your Sheet is readable, it’s time to design the actual meeting.
Aim for 30–45 minutes, same time each week, with the smallest group who can:
- Interpret the data
- Make decisions
- Own follow‑through
Who should be in the room?
Depending on the form:
- Sales intake: Sales lead, RevOps, marketing owner for the traffic source.
- Support / CS intake: CX lead, product liaison, ops.
- Feedback / NPS: Product manager, CX, someone from leadership once a month.
A simple agenda you can reuse
-
Start with the question, not the numbers (5 minutes)
- “What did we change last week?”
- “What do we expect to see because of that?”
-
Review headline metrics (10–15 minutes)
- Compare this week vs. last week and vs. a 4‑week rolling average.
- Highlight any deltas that are large enough to matter.
-
Walk through 3–5 specific cases (10–15 minutes)
- Use your “cases to review” table.
- Look at the full row: source, fields, timestamps, owner, outcome.
- Ask, “What’s the story here? What broke? What worked unusually well?”
-
Decide on 1–3 changes (10 minutes)
- Form changes (copy, fields, validation, routing).
- Process changes (SLAs, ownership, handoffs).
- Follow‑ups (manual outreach to specific segments or customers).
-
Log decisions and owners (5 minutes)
- Update the
Decisions & Experimentssection in the Sheet live. - Confirm deadlines and how you’ll check impact next week.
- Update the
The key is consistency. The ritual should feel the same each week, even as the content changes.

Step 5: Wire Simple Automations Around Your Ritual
Once the weekly habit exists, automation becomes a force multiplier—not a crutch.
You don’t need a complex stack. Start with:
1. Alerts for “review-worthy” submissions
Use Google Sheets + simple tools (like Zapier or Make) to:
- Send a Slack or email alert when:
- A high‑intent submission comes in from a strategic segment.
- A support form mentions certain keywords (e.g., billing, outage).
- An NPS response is a detractor with a long comment.
- Tag those rows in your Sheet with a
flag_for_weekly_reviewcolumn.
These alerts keep you responsive during the week and give you richer stories to review at the ritual.
2. Automatic enrichment and classification
Basic enrichment (via tools like Clearbit or FullContact) can:
- Fill in company size, industry, and location based on email domain.
- Classify leads into tiers (e.g., Tier 1, Tier 2, Tier 3) that you then slice by.
You can also use lightweight AI classification on free‑text fields:
- Sentiment (positive / neutral / negative).
- Topic (pricing, onboarding, support, feature request).
Keep it simple:
If a classification doesn’t change a decision you make weekly, it doesn’t belong in your first pass.
3. Pre-built views for different teams
Within the same Sheet, create additional tabs or filter views tailored for:
- CX team: Focus on response time, sentiment, and topics.
- Sales team: Focus on fit signals, source, and conversion.
- Product team: Focus on use cases, feature requests, and friction points.
This builds a shared source of truth while still respecting how each team works.
Step 6: Close the Loop With Form Changes
A weekly ops analytics ritual is only as good as the changes it drives back into your forms and workflows.
Some examples of changes you might make based on your sessions:
-
Clarify confusing questions.
If you see a pattern of incomplete or contradictory answers, tweak the label, add helper text, or change the field type. -
Refine progressive questions.
If returning users are dropping off when you ask deeper questions, revisit your progressive profiling strategy so it feels more like a conversation and less like an interrogation. (The post Beyond Required Fields: Progressive Profiling Strategies That Don’t Annoy Returning Users has concrete patterns here.) -
Adjust routing rules.
If Tier 1 leads are not getting faster responses, update your routing logic so Ezpa.ge + Sheets feed into the right queue with clear SLAs. -
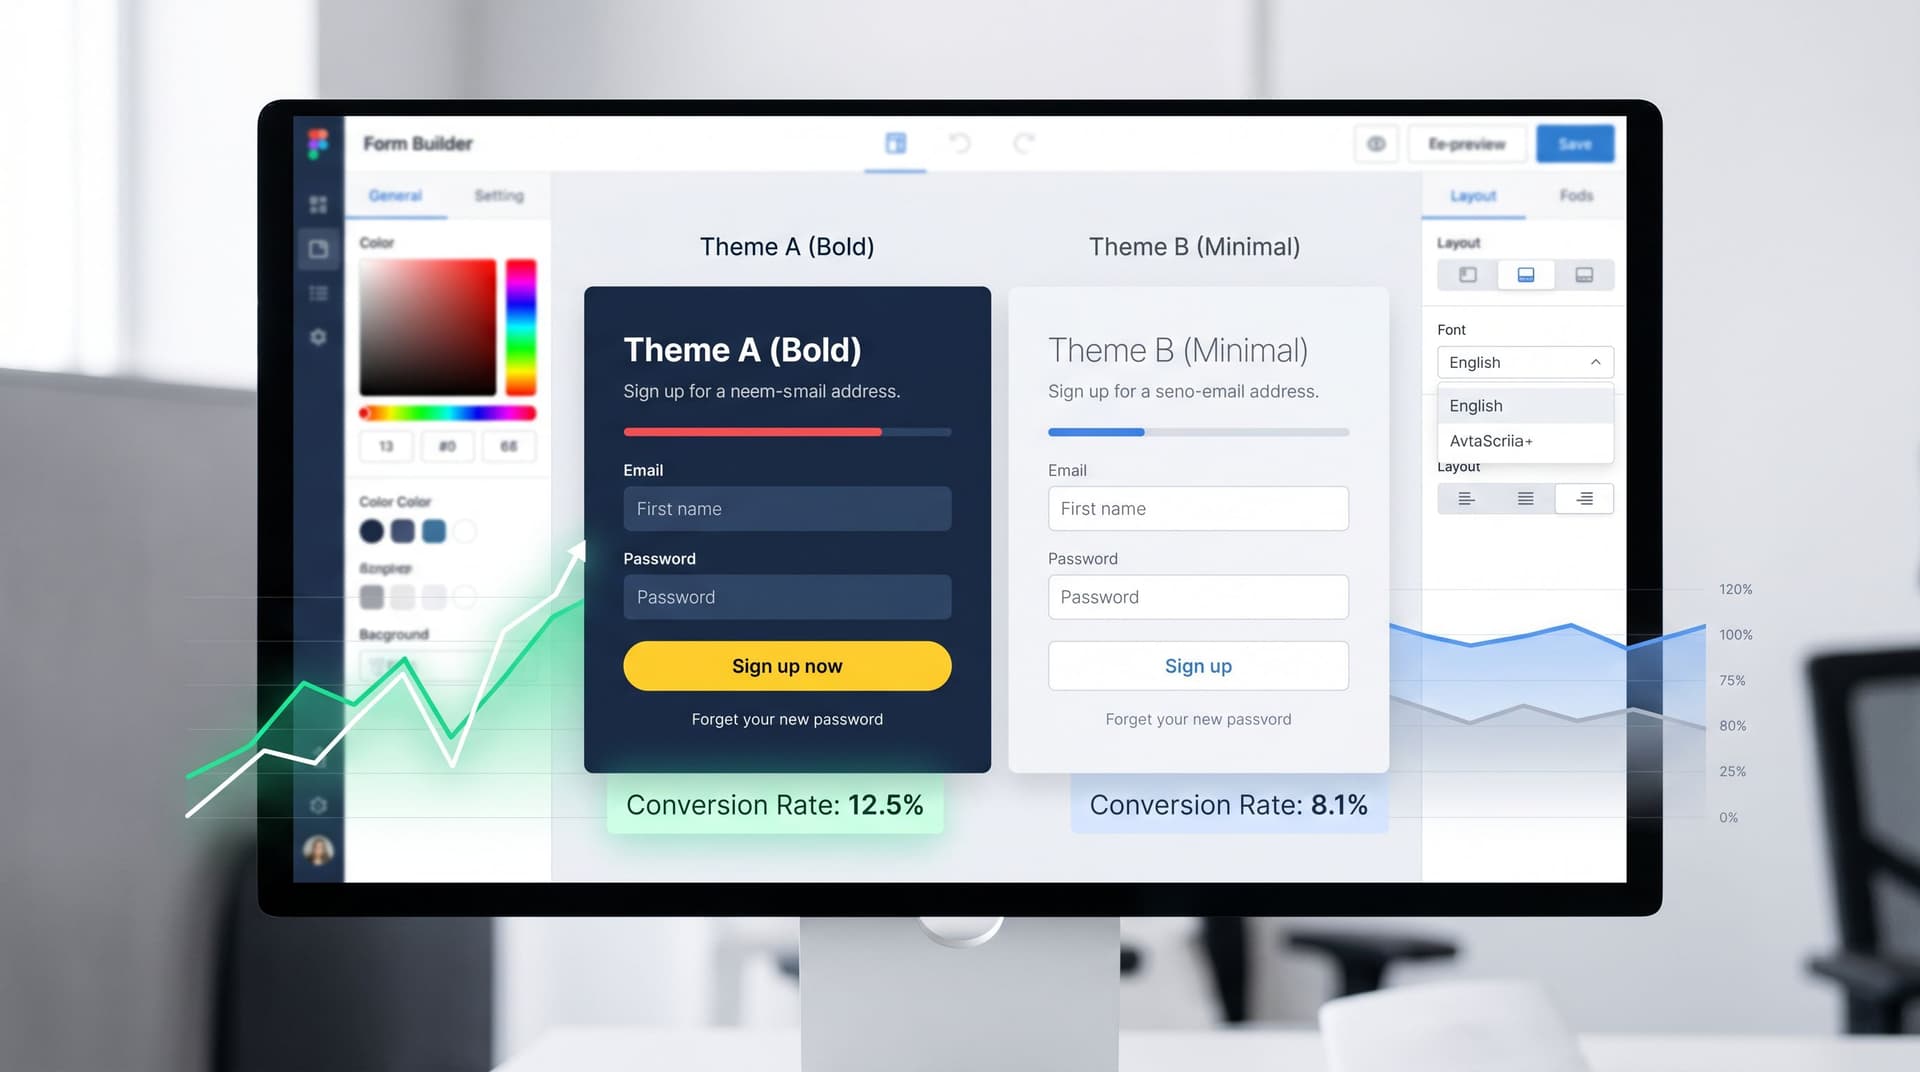
Experiment with themes and framing.
If certain segments convert poorly, try alternate Ezpa.ge themes, shorter flows, or different framing for the same questions. For inspiration on doing this without new pages, see Theme-Driven A/B Testing: Experimenting with Copy, Layout, and Visual Hierarchy Without New Pages.
The important part: treat your forms as living artifacts. Your weekly ritual is the heartbeat that keeps them evolving with your operations.
Step 7: Make the Ritual Survive Vacations, Reorgs, and New Hires
A great ritual that only works when one person is around is not a system. It’s a dependency.
To make your ops analytics habit durable:
1. Document the ritual in the Sheet itself
In your Weekly View tab, add a small “How this works” section that covers:
- Purpose of the ritual
- Which forms feed this Sheet
- Who attends and who facilitates
- Agenda outline
- Where decisions are logged
This way, a new hire can open the Sheet and understand the system without digging through old docs.
2. Rotate ownership
Assign a primary owner and a backup for each ritual. Rotate facilitation monthly so:
- More people build intuition from the data.
- The ritual doesn’t collapse when one person changes roles.
3. Review the ritual quarterly
Once a quarter, spend one session asking:
- Are these still the right headline metrics?
- Are we still answering the core question we started with?
- What decisions have we made that clearly paid off?
- What’s now muscle memory and can be automated or simplified?
Rituals should evolve—but intentionally, not by neglect.
Bringing It All Together
When you connect Ezpa.ge forms to Google Sheets and wrap them in weekly decision rituals, you get more than “better reporting.” You get:
- Clearer questions. Every form exists to answer something specific about your business, not just collect fields.
- Cleaner data. Because you look at it every week, you quickly spot and fix issues with fields, validation, and routing.
- Faster learning cycles. You’re not waiting for quarterly reviews; you’re nudging the system every seven days.
- Shared ownership. Sales, CX, product, and ops all see the same data and make decisions together.
Dashboards can be useful, but they’re optional. Rituals are not.
Where to Start This Week
You don’t need a full overhaul to get value. Here’s a simple way to take the first step in the next 7 days:
- Pick one Ezpa.ge form that clearly affects revenue, customer experience, or a key program.
- Open its connected Google Sheet and create a
Weekly Viewtab. - Define 3–5 headline metrics that answer one core question.
- Schedule a 30‑minute recurring meeting with the smallest group who can act on those metrics.
- Run the first session using the agenda above, and log 1–2 concrete changes.
That’s it. You’ve just moved from “We have data somewhere” to “We have an ops analytics ritual.”
As you refine that first loop, you can layer in more forms, more automation, and more nuance. But the foundation will be the same: forms that are structured for decisions, Sheets that are shaped for weekly review, and a team that knows exactly what to do when the numbers change.
If you’re already using Ezpa.ge—or thinking about it—this is where it shines: clean, shareable forms with real-time Google Sheets syncing, designed not just to capture data, but to power the decisions that run your business.
Set up that first Weekly View tab. Put the meeting on the calendar. Let the habit do the rest.