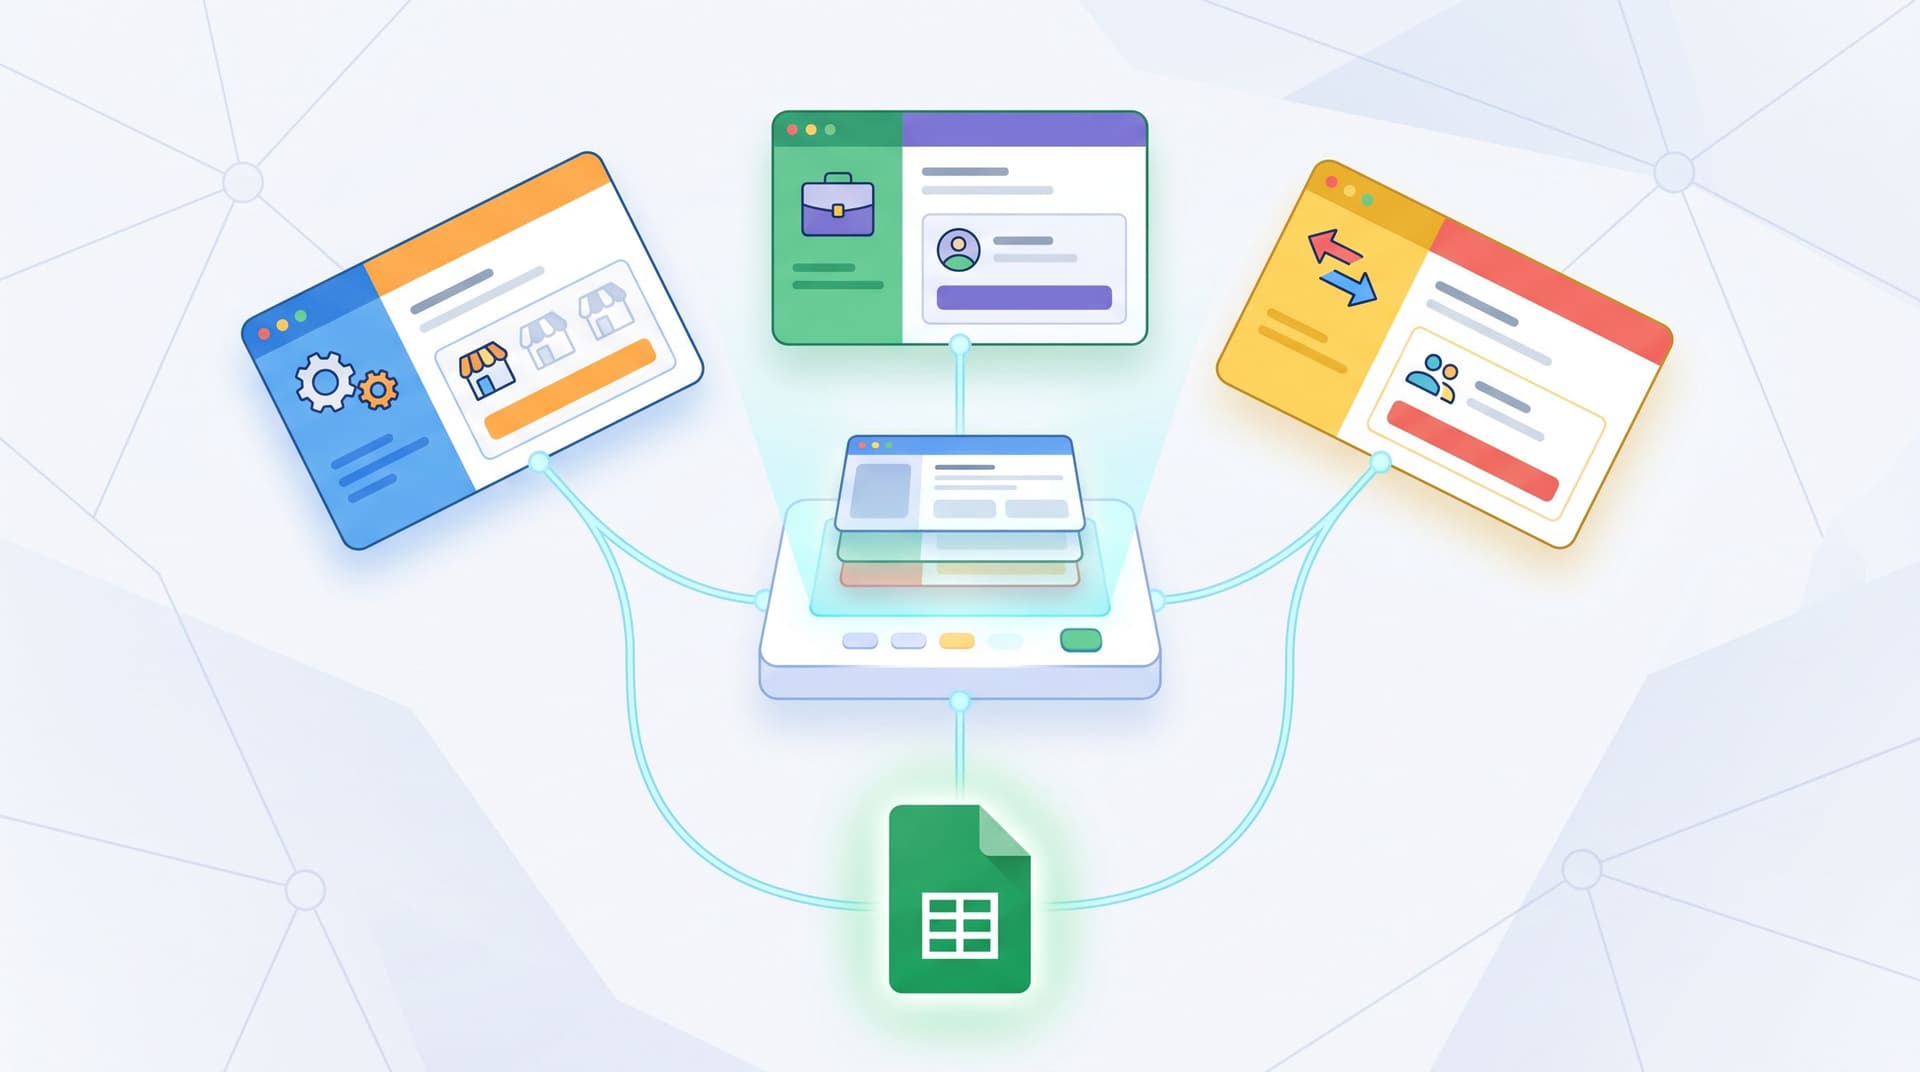
From Form to Funnel Map: Visualizing Every User Path in Google Sheets


Most teams know their forms are important. Fewer can clearly answer a simple question:
“What actually happens after someone hits submit?”
Not just for the happy path, but for every path:
- People who start but don’t finish
- People who click a secondary CTA instead of the main one
- People who say “Not now” but come back later
- People who give you a 2/10 on a feedback form vs. a 10/10
When you can’t see those paths, you end up managing your funnel by vibes:
- Campaigns get credit (or blame) without real evidence
- Teams argue about where drop-off happens
- “We’ll fix it next quarter” becomes the default answer
A funnel map anchored in Google Sheets changes that. When every form submission (and non-submission) flows into a structured Sheet, you can literally see how people move—from click, to form, to next step.
In this post, we’ll walk through how to go from a single Ezpa.ge form to a complete, Sheets-powered funnel map you can share with your team.
Why mapping every path matters
A funnel map is more than a pretty diagram. It’s a way to:
1. Turn raw form data into decisions
Forms already drive your business: demo requests, waitlists, applications, feedback. But without structure, your Google Sheet becomes a log, not a control panel.
A good funnel map lets you answer questions like:
- Which traffic sources create the highest qualified completion rate?
- Where do people stall—on which question, on which device?
- What happens after they submit: do they book a call, start a trial, reply to an email?
If you’ve read our piece on turning form + Sheets data into weekly decision rituals, a funnel map is the structural layer that makes those rituals possible.
2. Respect consent while still understanding behavior
As third-party tracking gets more constrained, you can’t rely on opaque scripts to reconstruct funnels. You have to design your own, consent-forward data flows.
That’s why funnels and forms belong together. When you treat forms as first-party data engines, your funnel map becomes:
- Transparent (users know what they’re sharing)
- Controllable (you can change it without touching a tag manager)
- Durable (less likely to break when browsers update their rules)
3. Align growth, product, and ops around one source of truth
Everyone has their own favorite tool—analytics, CRM, BI. But almost every team already trusts Google Sheets.
A Sheets-based funnel map:
- Lives where people already work
- Can be edited by non-technical teammates
- Is easy to copy, adapt, and share
If you’re running multiple brands or experiences from a single infrastructure, this becomes even more important. Your funnel map needs to work across themes, URLs, and teams—just like the “multi-brand, one stack” pattern we covered in this post.
Step 1: Start with a single form and a clear outcome
Before you touch Sheets, pick one Ezpa.ge form and one outcome.
Examples:
- "Book a sales call" from your demo request form
- "Start trial" from your product signup form
- "Trigger follow-up workflow" from your NPS or feedback form
Ask yourself:
-
What is the main ‘success’ state?
- Calendar event created
- Account activated
- Payment completed
-
What are the meaningful ‘non-success’ states?
- Started form but didn’t finish
- Finished form but didn’t take the next step
- Took an alternate route (e.g., clicked a support link instead of booking)
-
What time horizon matters?
- Same-session behavior (do they book right after submitting?)
- Within 24 hours (do they respond to the confirmation email?)
- Within 7 days (do they activate their account?)
You’re not building a forever-funnel yet. You’re defining a contained journey you can actually map.

Step 2: Wire your Ezpa.ge form into Google Sheets with structure in mind
With Ezpa.ge, syncing to Google Sheets is straightforward: each submission becomes a new row, each field becomes a column, and updates land in real time.
To make this Sheet a funnel map—not just a dump—you’ll want to design a few extra columns:
Core metadata columns
Add or confirm these fields in your Sheet (some may already exist depending on how you’ve set up Ezpa.ge):
submitted_at– timestamp of submissionform_idorform_name– which form this came fromsession_idoruser_id(if available) – to link multiple submissionssource– UTM source or high-level channelmedium– UTM medium (email, cpc, social, etc.)campaign– UTM campaign or internal campaign namedevice_type– inferred from user agent (mobile/desktop/tablet)
Funnel-intent columns
These are not user-facing fields; they’re your operational scaffolding:
funnel_stage_at_submit– e.g.,"aware","interested","ready_to_book"primary_cta_shown– e.g.,"book_call","start_trial"segment– e.g.,"SMB","mid-market","enterprise"based on form logic
You can populate these via:
- Hidden fields in the Ezpa.ge form
- URL parameters (e.g., campaign tags)
- Form logic that writes values to specific columns
The goal: every row should tell you who this is, what they saw, and what you hoped they’d do next.
Step 3: Capture the “next step” inside the same Sheet
A funnel map breaks if your “next step” lives in a different tool and never makes it back to Sheets.
For your chosen outcome, decide how you’ll record it in Google Sheets. A few patterns:
Pattern A: Calendar / booking tools
If your next step is “book a call” via tools like Calendly or Cal.com:
- Use the same
user_id,email, orsession_idin both the form and booking link (via URL params). - Export or sync bookings into a separate Sheet tab.
- Use
VLOOKUP,INDEX/MATCH, orXLOOKUPto bringbooked_atandmeeting_statusback into your main form Sheet.
Add columns to your main Sheet:
booked_call?–TRUE/FALSEbased on whether a match existsbooked_at– timestamp of bookingtime_to_book– formula:=IF(booked_call?, booked_at - submitted_at, "")
Pattern B: Product activation
If the next step is “account activated” or “first key action in product”:
- Have your product write a log to a Sheet (via an integration tool or Apps Script) keyed on
user_idoremail. - Use the same matching approach to bring activation data into the form Sheet.
Add columns:
activated?activated_attime_to_activate
Pattern C: Email or CRM workflows
If the next step is “clicked a link in email” or “moved to opportunity in CRM”:
- Use your email/CRM tool’s export or webhook features to push events into Sheets.
- Normalize those events into a simple table:
email,event_type,event_time. - Join them back into the form Sheet with formulas or a small script.
The key principle:
Your funnel map lives where your form lives.
If it doesn’t end up in the same Sheet, it doesn’t exist in your map.
Step 4: Turn rows into a visual funnel map
Once your Sheet includes both submission data and next-step data, you can build a visual map directly in Sheets.
4.1 Define your funnel stages
For a simple demo request funnel, you might use:
Visited formSubmitted formBooked callAttended call
If you’re working with feedback or NPS, you might use:
Submitted feedbackFlagged as detractor / passive / promoterFollow-up triggeredFollow-up completed
Create a new tab called Funnel_Map and build a small table:
| Stage | Count | Conversion from previous | Cumulative conversion | |-----------------|-------|--------------------------|-----------------------| | Visited form | | | | | Submitted form | | | | | Booked call | | | | | Attended call | | | |
You can fill these cells with formulas like:
Visited form= total uniquesession_idoruser_idthat saw the form (from your analytics export or a “view log” Sheet if you’re capturing it)Submitted form==COUNTA(submitted_at)Booked call==COUNTIF(booked_call?, TRUE)Attended call==COUNTIF(meeting_status, "attended")
Then calculate conversion:
- Conversion from previous:
=this_stage_count / previous_stage_count - Cumulative conversion:
=this_stage_count / visited_form_count
4.2 Visualize with charts
Use Google Sheets’ built-in charts to make the map shareable:
- A bar chart showing counts by stage
- A funnel-style chart (stacked bars with descending values)
- A line chart over time showing conversion rates week by week
Label your chart clearly:
- “Demo funnel: Visit → Submit → Book → Attend”
- “Feedback funnel: Submit → Follow-up triggered → Follow-up completed”
The goal isn’t pixel-perfect design; it’s a clear, at-a-glance story you can discuss in a meeting.

Step 5: Segment paths to see which users behave how
A single funnel map is good. Segmented funnel maps are where you start finding leverage.
Use the structured columns you set up earlier to slice your funnel:
By acquisition channel
- Compare
sourceandmedium:- Do paid search users submit at a higher rate but book fewer calls?
- Do partner referrals have lower volume but higher attendance?
By device
- Compare
device_type:- Is mobile submit rate strong but time-to-book slower?
- Does desktop have better completion for longer forms?
If you see huge gaps, it might be time to revisit how your forms behave on different screens—our post on responsive form stacks goes deep on this.
By user profile
- Use
segmentor key fields (company size, role, industry):- Are enterprise leads more likely to submit but less likely to self-book?
- Are smaller teams more responsive to immediate trial starts vs. calls?
Implement segmentation in Sheets by:
- Creating separate
Funnel_Maptabs per segment - Or adding a
segmentfilter to a single funnel table usingFILTERor pivot tables
The outcome: you stop asking “What’s our conversion rate?” and start asking “For which users, from which channels, through which paths?”
Step 6: Trace individual journeys for qualitative insight
Numbers tell you where the funnel leaks. Individual paths tell you why.
Use your Sheet to reconstruct a few real journeys:
- Filter by
booked_call? = FALSEand high-intent fields (e.g., budget, role) to find high-potential users who didn’t convert. - For each, look at:
source,medium,campaign- Time of day, device type
- Any long-text answers that hint at objections or confusion
- Compare with a few high-intent users who did convert.
Questions to ask:
- Did non-converters see different messaging or themes?
- Did they come from channels that set different expectations?
- Did they land on a variant of the form with different copy or fields?
If you’re using Ezpa.ge themes and custom URLs, this is where your funnel map can reveal the impact of:
- Different visual treatments
- Different custom URL structures
- Different question ordering or progressive profiling strategies
This is also where qualitative notes from your team belong. Encourage sales, CX, and product to add comments on specific rows when they learn something meaningful.
Step 7: Close the loop with experiments
A funnel map without iteration is just a report. The real value shows up when you:
- Identify a drop-off or delay
- Form a hypothesis
- Change something in your Ezpa.ge form or follow-up flow
- Watch the effect in your Sheets funnel map
Example experiments:
-
Reduce friction on mobile:
Hypothesis: A long free-text field is killing mobile completion.
Change: Replace it with a multiple-choice question + optional text.
Measure: MobileSubmitted form / Visited formbefore vs. after. -
Clarify the next step:
Hypothesis: People don’t realize they’re expected to book a call after submitting.
Change: Update form copy and thank-you state to make the booking step explicit.
Measure:Booked call / Submitted formandtime_to_book. -
Segment-specific follow-up:
Hypothesis: Enterprise leads need a different follow-up (e.g., custom deck) to book.
Change: Conditional routing and tailored email sequences.
Measure:Booked callrate bysegment.
Because your Ezpa.ge forms sync to Sheets in real time, you don’t need a heavyweight analytics stack to see results. A few well-placed formulas and charts will show you whether your changes are moving the right stages.
Bringing it all together
When you’ve done this for one form and one outcome, you’ve built a pattern you can reuse:
- Forms define the questions, intent, and consent.
- Ezpa.ge + Google Sheets provide the live, structured data.
- Funnel maps in Sheets show how real people move—from form to next step.
From there, it’s natural to:
- Add more forms (signups, feedback, applications) into the same funnel framework
- Standardize columns and naming so every new form “plugs in” cleanly
- Layer on more advanced models—like Sheets-native scoring or churn prediction—using the same backbone
If you’re curious about that last part, our guide to Sheets-native scoring is a good next read.
Summary
A form is not just a box to collect data. It’s the first visible step in a user’s journey—and the most reliable place to anchor your funnel.
By syncing Ezpa.ge forms into Google Sheets and designing your Sheet with funnel stages in mind, you can:
- See exactly how many people move from visit → submit → next step
- Compare behavior by channel, device, and segment
- Trace individual journeys to understand why people convert (or don’t)
- Run focused experiments and watch the impact in real time
You don’t need a new platform or a complex tracking setup. You need a clear outcome, a structured Sheet, and a habit of looking at the map together.
Your next move
Pick one high-impact form—demo request, trial signup, or key feedback flow—and:
- Wire it cleanly into Google Sheets with the metadata and intent columns you’ll need.
- Define a simple funnel (e.g., Visit → Submit → Next step) and build a tiny
Funnel_Maptab. - Share that map with your team and ask one question: “What’s the first experiment we should run?”
Once you’ve seen how powerful a single Sheets-based funnel map can be, scaling it across your forms becomes the obvious next step.
If you’re ready to make that leap, start by spinning up a new Ezpa.ge form, connect it to Google Sheets, and sketch your first funnel map. The data is already there—you’re just giving it a shape your team can finally see and use.