From Form to Revenue Signal: Using Google Sheets to Map Submission Data to Pipeline Stages


Forms are where strangers become leads, leads become opportunities, and opportunities (sometimes) become revenue.
But for many teams, that transformation breaks at the most basic step: turning raw form submissions into a clear, shared view of the pipeline.
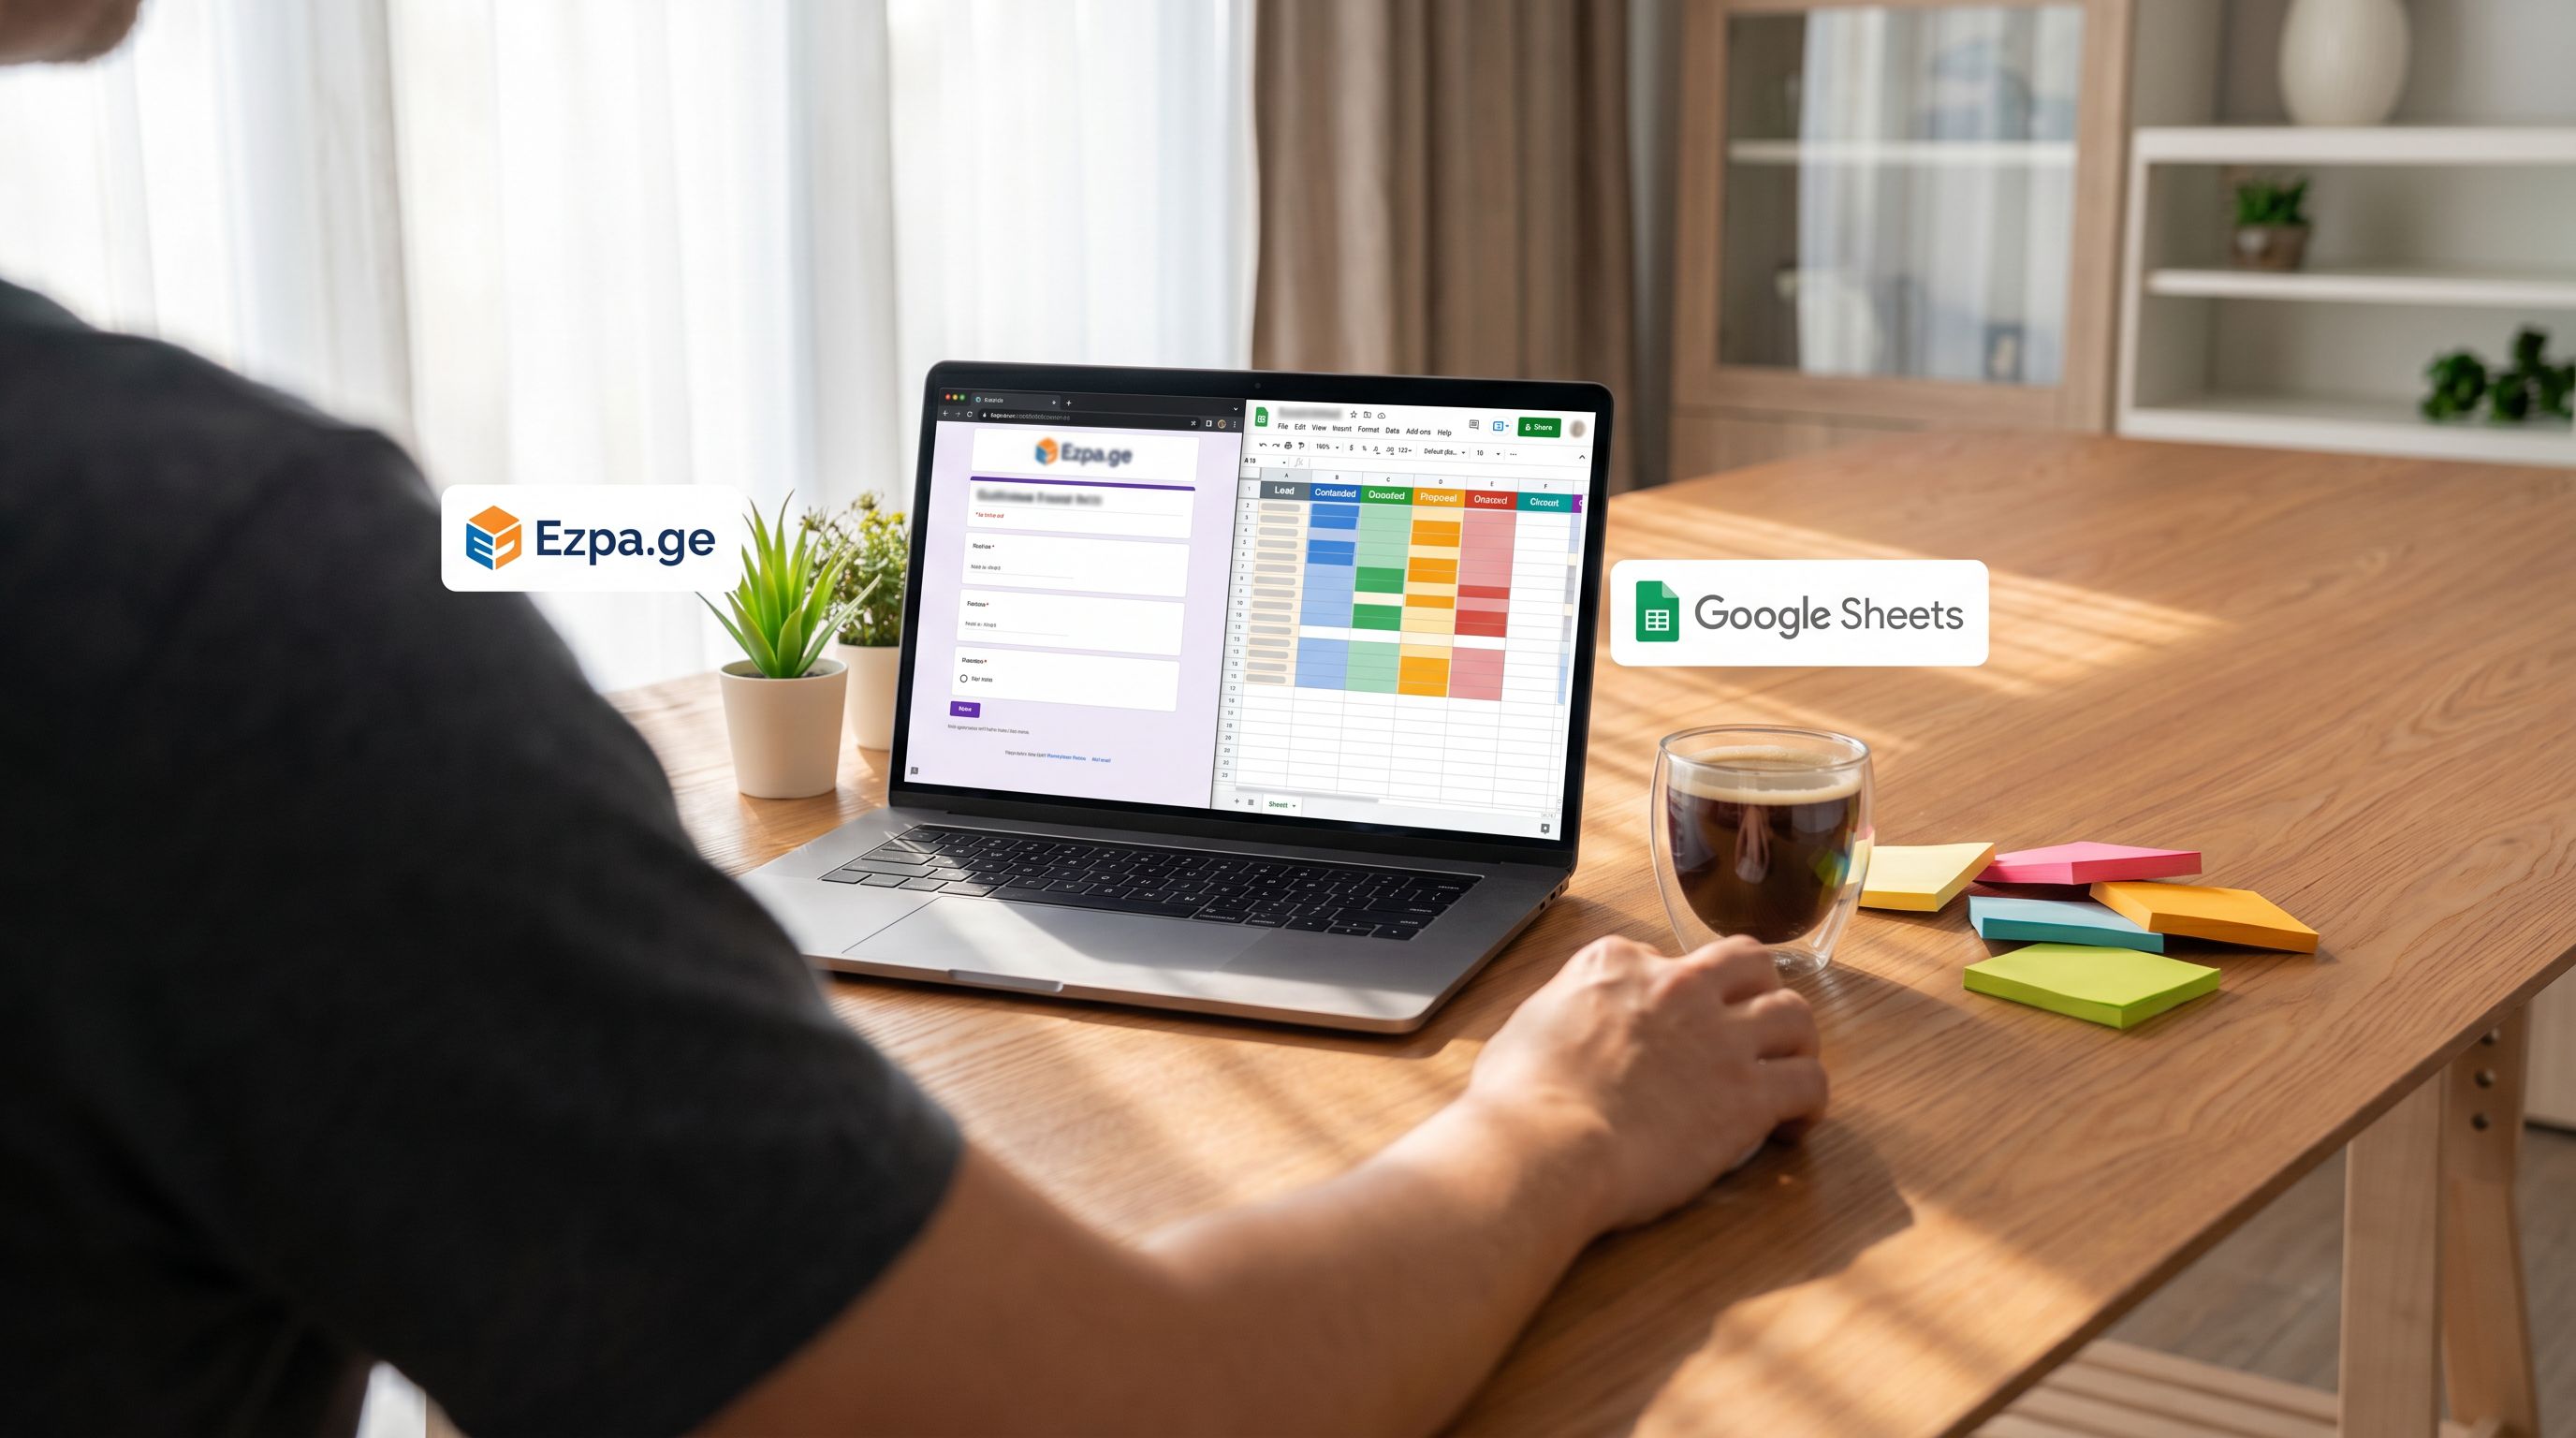
Someone fills out a beautifully themed Ezpa.ge form. The data lands in Google Sheets. And then:
- Sales has their own copy of the sheet.
- Marketing has a slightly different version for reporting.
- Ops is trying to glue it all into the CRM.
No one fully trusts any single view. Pipeline reviews turn into data archaeology. High-intent leads get lost in the shuffle.
This post is about closing that gap: how to turn form responses (especially when they sync into Google Sheets via Ezpa.ge) into a reliable revenue signal—by mapping each submission to a clear, trackable pipeline stage.
We’ll walk through practical setups you can implement in an afternoon, not a quarter.
Why Mapping Form Data to Pipeline Stages Matters
Before we get tactical, it’s worth grounding in why this work is so leveraged.
1. You stop confusing volume with progress
Raw submission counts tell you how many people raised their hands.
Pipeline stages tell you how far those hands actually got.
When you map form data to stages, you can answer questions that matter:
- How many demo requests became qualified opportunities?
- Which campaign sources lead to closed-won deals, not just clicks?
- Where are leads stalling—between “New” and “Contacted,” or between “Proposal” and “Closed”?
This is the difference between a vanity metric dashboard and a revenue dashboard.
2. You align teams around a single source of truth
If every form submission lands in a Sheet with a clear stage, owner, and next step, you don’t need three different spreadsheets and a weekly reconciliation meeting.
Instead, you get:
- Shared language: everyone knows what “New,” “Working,” and “Qualified” mean.
- Cleaner handoffs: marketing, sales, and success see the same stages, not three different flavors of the funnel.
- Fewer “What’s going on with this lead?” threads: the Sheet tells you.
This is exactly the kind of connective tissue we explored in Forms as Signal Hubs: Connecting Google Sheets, CRMs, and Webhooks Without Engineering Help—but here we’re zooming in on pipeline structure.
3. You unlock automation without overbuilding tools
Once every row in your Sheet has a stage, you can:
- Trigger follow-up emails when a lead moves from "New" to "Contacted."
- Notify reps in Slack when a row hits "High Priority."
- Update your CRM via no-code tools, instead of manual copy-paste.
You don’t need a custom internal app for this. A well-structured Sheet, synced from Ezpa.ge, can act like a lightweight workflow engine—similar to the approach in From Form to Workflow Engine: Designing Conditional Paths That Replace Internal Tools.
Start at the End: Define Your Pipeline Stages First
Most teams start by designing the form, then figure out what to do with the data later.
Flip that.
Step 1: Write down your real-world process
Forget tools for a moment. Ask:
From the moment someone submits this form, what actually happens, step by step, until revenue is realized (or not)?
For a sales demo request, that might look like:
- New lead created
- Rep reviews and qualifies
- Rep contacts lead
- Discovery call booked
- Proposal sent
- Closed-won or closed-lost
For a customer success expansion form, it might be:
- Expansion interest logged
- CSM reviews account health
- CSM runs discovery
- Expansion plan proposed
- Expansion closed or deferred
Step 2: Translate steps into clear, mutually exclusive stages
You don’t need 20 stages. You need just enough to:
- Reflect reality
- Support reporting
- Drive actions
A simple starting template for a sales-focused form:
- New – Just submitted, not yet reviewed.
- Under Review – Being triaged for fit/priority.
- Working – Rep has engaged; active back-and-forth.
- Qualified – Meets your criteria (e.g., BANT, ICP).
- Proposal/Quote Sent – A concrete offer is on the table.
- Closed-Won – Customer has signed or paid.
- Closed-Lost – Opportunity is no longer active.
Make each stage:
- Descriptive – Anyone can guess what’s happening.
- Exclusive – A row can only be in one stage at a time.
- Actionable – It’s clear what needs to happen next.
Step 3: Document the rules
For each stage, define:
- Entry criteria – What must be true for a row to enter this stage?
- Exit criteria – What moves it out of this stage?
- Owner – Who is responsible for moving it forward?
This can live in a simple “Stage Definitions” tab in your Sheet.
Design Your Form With Stages in Mind
Once you know your stages, you can design your Ezpa.ge form to capture the signals you’ll need to move rows through that pipeline.
Ask: “What do we need to know to place this submission on the map?”
For each stage transition, list the information you’ll need. For example:
- To move from New → Under Review: source, company size, use case.
- To move from Under Review → Working: decision-maker role, timeline, budget hint.
- To move from Working → Qualified: strong fit on ICP criteria, clear problem.
Then work backwards to your form fields.
Example field set for a B2B demo request form
- Name
- Company name
- Company size (dropdown)
- Role / title
- Primary use case (multi-select or dropdown)
- Estimated timeline (radio buttons)
- "What’s the main problem you’re trying to solve?" (short paragraph)
Each of these fields should:
- Map to a column in your Sheet
- Support a stage decision (now or later)
- Avoid being “nice to have”—if you don’t use it, don’t ask it
If you want to go deeper on question design, especially when you’ll later feed this data into AI-based scoring or routing, AI-Aware Question Design: Writing Prompts That Train Better Internal Models From Day One is a helpful companion.
Use form theming and microcopy to set expectations
The better you explain what happens after submission, the more accurate your pipeline data will be.
- Clarify who will follow up and when.
- Set expectations for next steps (e.g., “We’ll review your request within one business day and follow up with available times”).
- Use trust-building patterns—like those in Trust at First Tap: Mobile Form Patterns That Make Users Comfortable Sharing Sensitive Data—to encourage honest, complete answers.
Structure Your Google Sheet Like a Lightweight CRM
Once Ezpa.ge is syncing submissions into Google Sheets, the magic is in how you structure that Sheet.
Core columns to add (beyond raw form fields)
Alongside the columns Ezpa.ge creates from your form fields, add these manually:
- Stage – The current pipeline stage (use Data Validation with a dropdown).
- Owner – Who is responsible (rep, CSM, team).
- Priority – e.g., High / Medium / Low.
- Created At – Timestamp from the form submission.
- Last Updated – When the row was last touched.
- Next Action – Short free-text description (“Send follow-up deck,” “Schedule discovery call”).
- Next Action Date – When that action should happen.
This turns your Sheet from a passive log into an active working queue.
Use Data Validation to enforce clean stages
In Google Sheets:
- Select the Stage column.
- Go to Data → Data validation.
- Choose Dropdown and enter your stage list (New, Under Review, Working, Qualified, Proposal, Closed-Won, Closed-Lost).
This:
- Prevents typos like “Qualifed” or “Closed Won.”
- Makes it easy for reps to update stages quickly.
- Keeps reporting clean.
Add calculated helper columns
A few simple formulas can make your Sheet dramatically more useful.
-
Days in Stage
-
Add a column
Days in Stage. -
Use a formula like:
=IF([@[Stage]]="","",TODAY()-[@[Last Updated]]) -
This helps you spot stalled leads.
-
-
Lead Source (normalized)
If you have messy UTM data, create a normalizedSourcecolumn that groups similar values (“Paid Social,” “Organic Search,” “Partner,” etc.). This will matter for later analysis. -
Stage Order
To make sorting and funnel analysis easier, create a hiddenStage Ordercolumn:- New = 1
- Under Review = 2
- Working = 3
- Qualified = 4
- Proposal = 5
- Closed-Won = 6
- Closed-Lost = 7
Then you can sort by this column to see progression.
Freeze headers and use filters as views
- Freeze the first row so headers stay visible.
- Turn on filters and save common filtered views:
- My leads (Owner = me, Stage in [New, Under Review, Working])
- New today (Stage = New, Created At = today)
- Stalled (Days in Stage > 7, Stage in [Under Review, Working])
Treat these as lightweight “pipelines” for different teammates.
Map Submissions to Stages Automatically Where You Can
Manual updates will always play a role, but you can use simple rules to auto-assign initial stages and priorities.
Use formulas to assign an initial stage
Create a column called Initial Stage and use a formula based on form fields. For example, if you have Company Size and Timeline columns:
=IF(AND([@[Company Size]]="500+",[@[Timeline]]="This quarter"),
   "Working",
   "New")
Then, use this as the default value for Stage when a row is first created. You can:
- Use an
IFformula inStagethat falls back toInitial StageifStageis blank. - Or periodically copy
Initial StageintoStagefor newly created rows.
Auto-prioritize with simple scoring
You don’t need full-blown AI to get value from scoring.
Add a Score column and assign points based on fields:
- Company Size = 500+ → +3
- Role contains “VP” or “Head of” → +2
- Timeline = “This month” → +3
- Use case includes “Migration” or “Enterprise rollout” → +2
Then map score to priority:
- Score ≥ 7 → High
- Score 4–6 → Medium
- Score ≤ 3 → Low
If you’re ready to go further and use ML-based models at the edge (before data hits your CRM), AI Scoring at the Edge: Using Form Responses to Auto-Prioritize Leads Before They Hit Your CRM goes much deeper.
Use conditional formatting for visual cues
In Google Sheets:
- Color Stage cells by value (e.g., New = gray, Working = blue, Qualified = green, Closed-Lost = red).
- Highlight High priority rows.
- Flag rows where
Days in Stage> threshold (e.g., 7 days) with a warning color.
This turns your Sheet into a visual pipeline board.
Turn Your Sheet Into a Revenue Signal, Not Just a Log
Once your structure is in place, the next step is to make sure your Sheet actually drives decisions.
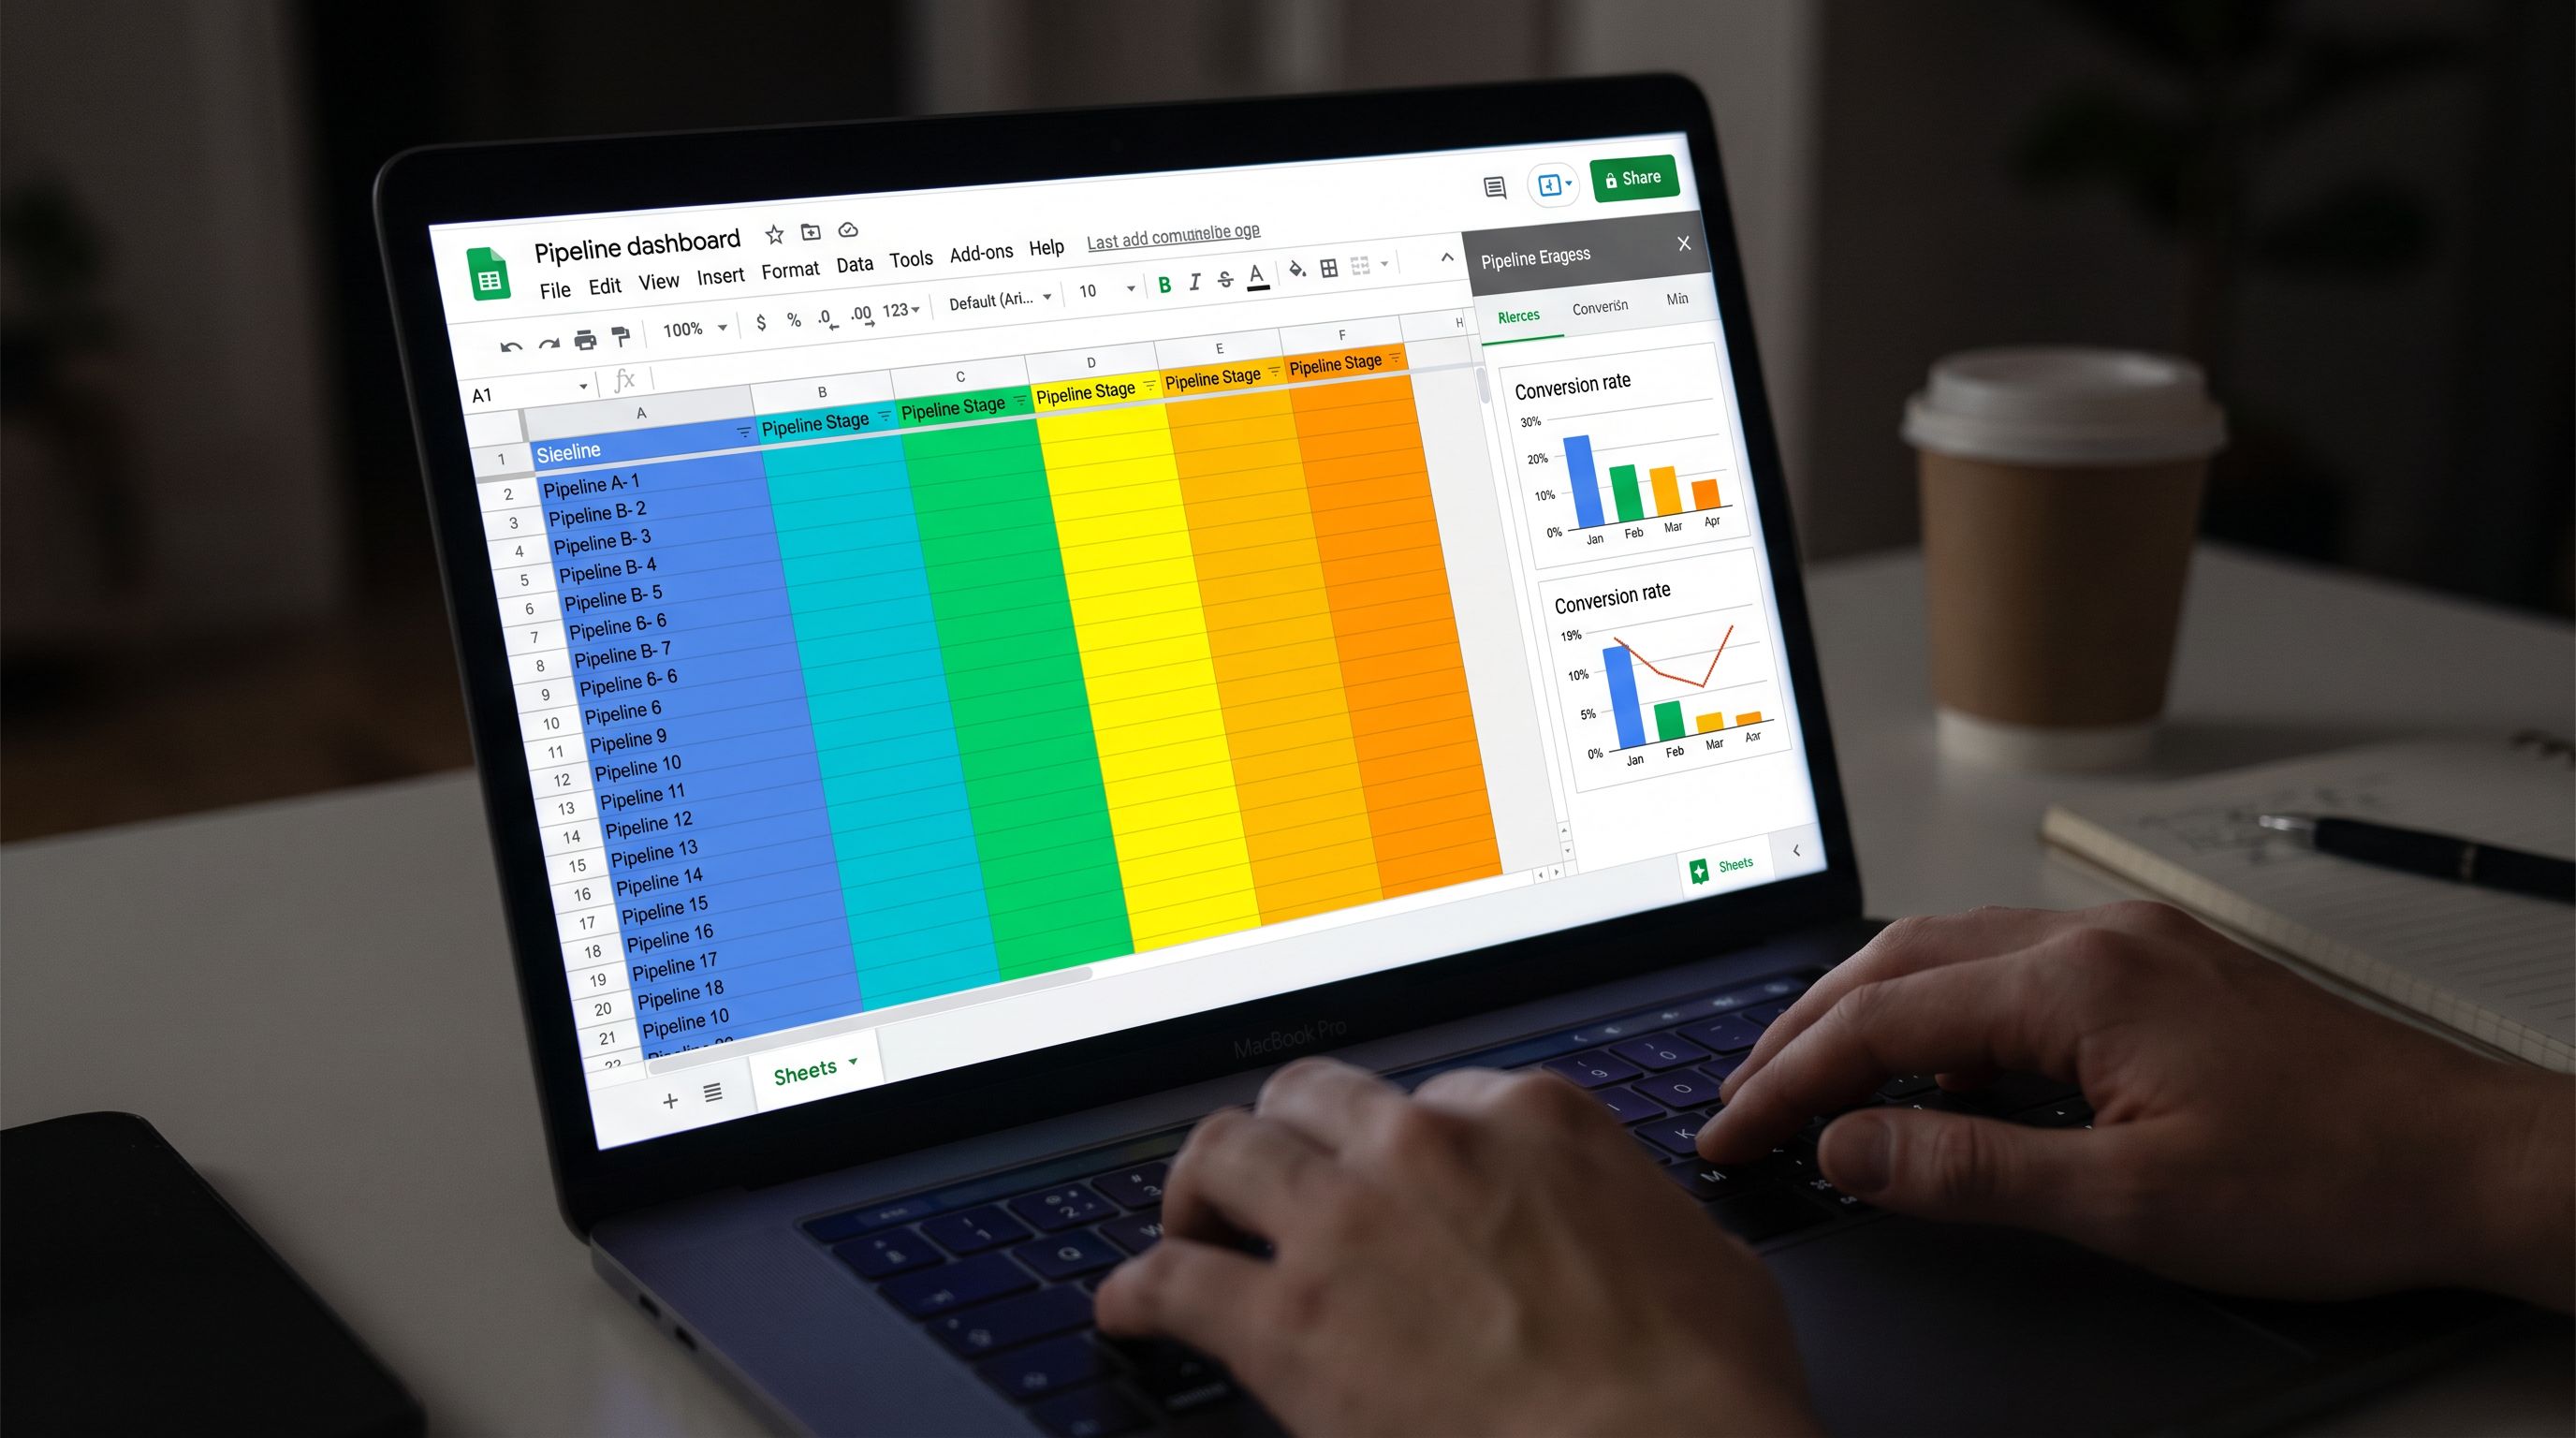
Build simple funnel views with Pivot Tables
You don’t need BI tools to understand conversion.
- Select your data range.
- Go to Insert → Pivot table.
- Create a pivot that shows:
- Rows: Stage
- Values: Count of submissions
This gives you a quick snapshot of how many rows sit in each stage.
Then, create another pivot by Source and Stage to see which channels are producing real opportunities and closed-won deals.
Track stage-to-stage conversion
Add a column Final Stage that holds the last stage a row reaches (for most setups, this will be the same as Stage, but it’s useful if you later archive or move data).
Then:
- Count how many rows ever reached Qualified.
- Count how many of those later reached Closed-Won.
- Compute conversion:
Closed-Won / Qualified.
Repeat for each stage transition.
This helps you decide where to invest:
- If New → Working is weak, you have a follow-up problem.
- If Qualified → Closed-Won is weak, you may have a positioning, pricing, or fit problem.
Add a simple revenue column
If you can attach deal value to each row (even approximately):
- Add a
Deal Valuecolumn. - For
Closed-Wonrows, fill in the actual or expected amount.
Now your pivots can show:
- Total pipeline value by stage.
- Revenue by source.
- Average deal size by use case.
This is where your Sheet stops being “a list of form fills” and becomes a revenue signal.
Connect Your Sheet to the Rest of Your Stack
Google Sheets is a great control panel, but you’ll often want your stages to drive actions elsewhere.
Common integrations to consider
-
CRM updates (e.g., HubSpot, Salesforce):
Use tools like Zapier, Make, or native connectors to:- Create or update contacts when a new row appears.
- Update the deal stage when the
Stagecolumn changes.
-
Slack notifications:
- Post to a channel when a new High priority lead is created.
- DM a rep when a row is assigned to them.
-
Email sequences:
- Trigger a nurture sequence when a lead is in Under Review for more than X days.
- Send a feedback request when a row moves to Closed-Won or Closed-Lost.
Because Ezpa.ge already handles real-time syncing to Sheets, you can centralize your logic there and let other tools listen for changes.
If you’re interested in using forms as the primary integration surface (rather than building custom tools), Forms as Signal Hubs: Connecting Google Sheets, CRMs, and Webhooks Without Engineering Help walks through patterns you can reuse here.
Keep the System Simple Enough That People Actually Use It
The biggest risk with any pipeline framework is overcomplication.
A few guardrails to keep your Sheet useful:
- Limit stages – If you’re above 8–10 stages for a single form’s pipeline, consider merging or removing.
- Standardize naming – Use the same stage names across forms where possible.
- Schedule light maintenance – A 30-minute weekly review to:
- Clean up obviously outdated rows.
- Merge duplicates.
- Check that owners and next actions are filled.
- Make it visible – Use your Sheet as the basis for pipeline reviews, not a separate report. This reinforces that it’s the source of truth.
Remember: the goal isn’t the most sophisticated system. It’s the simplest system that reliably turns forms into revenue signals.
Recap: From Form to Revenue Signal
Let’s pull it all together.
- Define your pipeline first. Write down the real-world steps from submission to revenue, then translate them into clear, mutually exclusive stages.
- Design your form to support those stages. Every field should help you place or progress a submission in the pipeline.
- Structure your Google Sheet like a lightweight CRM. Add Stage, Owner, Priority, Next Action, and helper columns like Days in Stage.
- Automate where it’s easy. Use formulas to set initial stages and priorities, and conditional formatting to make status obvious at a glance.
- Turn data into decisions. Use pivot tables and basic calculations to understand conversion, pipeline value, and bottlenecks.
- Connect to the rest of your stack. Let stage changes in Sheets drive CRM updates, Slack alerts, and email sequences.
- Keep it maintainable. Fewer stages, consistent naming, and regular light cleanup beat a perfect-but-brittle system.
Do this well, and your Ezpa.ge forms stop being just “where leads come from.” They become the front door to a pipeline you can actually see, trust, and improve.
Ready to Turn Your Forms Into a Revenue Signal?
You don’t need a new CRM or a data warehouse to get started. You need:
- One Ezpa.ge form that matters (demo requests, partner applications, expansion interest).
- One Google Sheet synced in real time.
- One clear set of stages and owners.
From there, you can layer on scoring, automation, and richer analytics as you go.
Open up your highest-intent form, sketch your stages, and turn that empty Sheet into a living, breathing pipeline. Your future self—staring at a clean, trustworthy revenue view—will thank you.